Comanche vs Immigrants from Sri Lanka Unemployment Among Ages 30 to 34 years
COMPARE
Comanche
Immigrants from Sri Lanka
Unemployment Among Ages 30 to 34 years
Unemployment Among Ages 30 to 34 years Comparison
Comanche
Immigrants from Sri Lanka
6.3%
UNEMPLOYMENT AMONG AGES 30 TO 34 YEARS
0.0/ 100
METRIC RATING
271st/ 347
METRIC RANK
5.3%
UNEMPLOYMENT AMONG AGES 30 TO 34 YEARS
80.2/ 100
METRIC RATING
126th/ 347
METRIC RANK
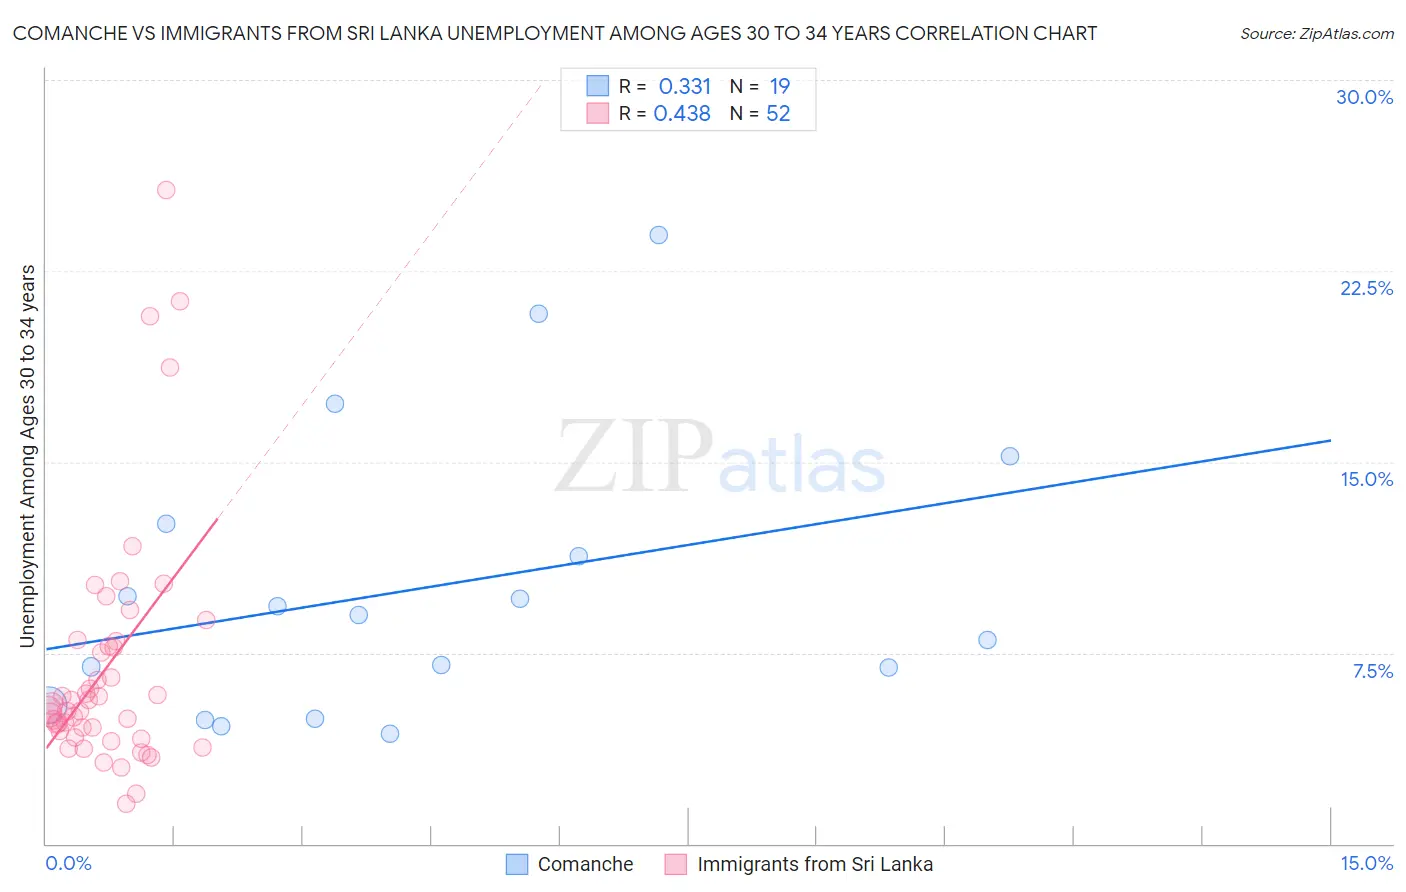
Comanche vs Immigrants from Sri Lanka Unemployment Among Ages 30 to 34 years Correlation Chart
The statistical analysis conducted on geographies consisting of 107,264,456 people shows a mild positive correlation between the proportion of Comanche and unemployment rate among population between the ages 30 and 34 in the United States with a correlation coefficient (R) of 0.331 and weighted average of 6.3%. Similarly, the statistical analysis conducted on geographies consisting of 146,711,794 people shows a moderate positive correlation between the proportion of Immigrants from Sri Lanka and unemployment rate among population between the ages 30 and 34 in the United States with a correlation coefficient (R) of 0.438 and weighted average of 5.3%, a difference of 17.6%.
Unemployment Among Ages 30 to 34 years Correlation Summary
| Measurement | Comanche | Immigrants from Sri Lanka |
| Minimum | 4.3% | 1.6% |
| Maximum | 23.9% | 25.7% |
| Range | 19.6% | 24.1% |
| Mean | 10.1% | 7.0% |
| Median | 9.0% | 5.4% |
| Interquartile 25% (IQ1) | 5.4% | 4.3% |
| Interquartile 75% (IQ3) | 12.6% | 7.9% |
| Interquartile Range (IQR) | 7.1% | 3.6% |
| Standard Deviation (Sample) | 5.6% | 4.9% |
| Standard Deviation (Population) | 5.5% | 4.8% |
Similar Demographics by Unemployment Among Ages 30 to 34 years
Demographics Similar to Comanche by Unemployment Among Ages 30 to 34 years
In terms of unemployment among ages 30 to 34 years, the demographic groups most similar to Comanche are Blackfeet (6.3%, a difference of 0.11%), Ottawa (6.3%, a difference of 0.12%), U.S. Virgin Islander (6.3%, a difference of 0.13%), Immigrants from Senegal (6.3%, a difference of 0.19%), and French American Indian (6.3%, a difference of 0.20%).
| Demographics | Rating | Rank | Unemployment Among Ages 30 to 34 years |
| Chickasaw | 0.0 /100 | #264 | Tragic 6.2% |
| Americans | 0.0 /100 | #265 | Tragic 6.2% |
| Seminole | 0.0 /100 | #266 | Tragic 6.2% |
| Immigrants | Mexico | 0.0 /100 | #267 | Tragic 6.2% |
| Immigrants | Haiti | 0.0 /100 | #268 | Tragic 6.2% |
| French American Indians | 0.0 /100 | #269 | Tragic 6.3% |
| Immigrants | Senegal | 0.0 /100 | #270 | Tragic 6.3% |
| Comanche | 0.0 /100 | #271 | Tragic 6.3% |
| Blackfeet | 0.0 /100 | #272 | Tragic 6.3% |
| Ottawa | 0.0 /100 | #273 | Tragic 6.3% |
| U.S. Virgin Islanders | 0.0 /100 | #274 | Tragic 6.3% |
| Ecuadorians | 0.0 /100 | #275 | Tragic 6.3% |
| Pennsylvania Germans | 0.0 /100 | #276 | Tragic 6.3% |
| Immigrants | Ecuador | 0.0 /100 | #277 | Tragic 6.3% |
| Osage | 0.0 /100 | #278 | Tragic 6.3% |
Demographics Similar to Immigrants from Sri Lanka by Unemployment Among Ages 30 to 34 years
In terms of unemployment among ages 30 to 34 years, the demographic groups most similar to Immigrants from Sri Lanka are Greek (5.3%, a difference of 0.020%), Immigrants from Brazil (5.3%, a difference of 0.070%), Taiwanese (5.3%, a difference of 0.080%), Immigrants from Italy (5.3%, a difference of 0.10%), and Immigrants from Uruguay (5.3%, a difference of 0.10%).
| Demographics | Rating | Rank | Unemployment Among Ages 30 to 34 years |
| New Zealanders | 82.5 /100 | #119 | Excellent 5.3% |
| Immigrants | Poland | 82.4 /100 | #120 | Excellent 5.3% |
| Romanians | 82.3 /100 | #121 | Excellent 5.3% |
| Immigrants | Netherlands | 81.8 /100 | #122 | Excellent 5.3% |
| Immigrants | Italy | 81.1 /100 | #123 | Excellent 5.3% |
| Immigrants | Brazil | 80.8 /100 | #124 | Excellent 5.3% |
| Greeks | 80.4 /100 | #125 | Excellent 5.3% |
| Immigrants | Sri Lanka | 80.2 /100 | #126 | Excellent 5.3% |
| Taiwanese | 79.4 /100 | #127 | Good 5.3% |
| Immigrants | Uruguay | 79.3 /100 | #128 | Good 5.3% |
| Poles | 78.8 /100 | #129 | Good 5.3% |
| Germans | 77.8 /100 | #130 | Good 5.3% |
| Immigrants | Eastern Europe | 77.4 /100 | #131 | Good 5.3% |
| Carpatho Rusyns | 77.3 /100 | #132 | Good 5.3% |
| Immigrants | Northern Europe | 77.3 /100 | #133 | Good 5.3% |