New Zealander vs Serbian Unemployment Among Ages 30 to 34 years
COMPARE
New Zealander
Serbian
Unemployment Among Ages 30 to 34 years
Unemployment Among Ages 30 to 34 years Comparison
New Zealanders
Serbians
5.3%
UNEMPLOYMENT AMONG AGES 30 TO 34 YEARS
82.5/ 100
METRIC RATING
119th/ 347
METRIC RANK
5.4%
UNEMPLOYMENT AMONG AGES 30 TO 34 YEARS
72.9/ 100
METRIC RATING
138th/ 347
METRIC RANK
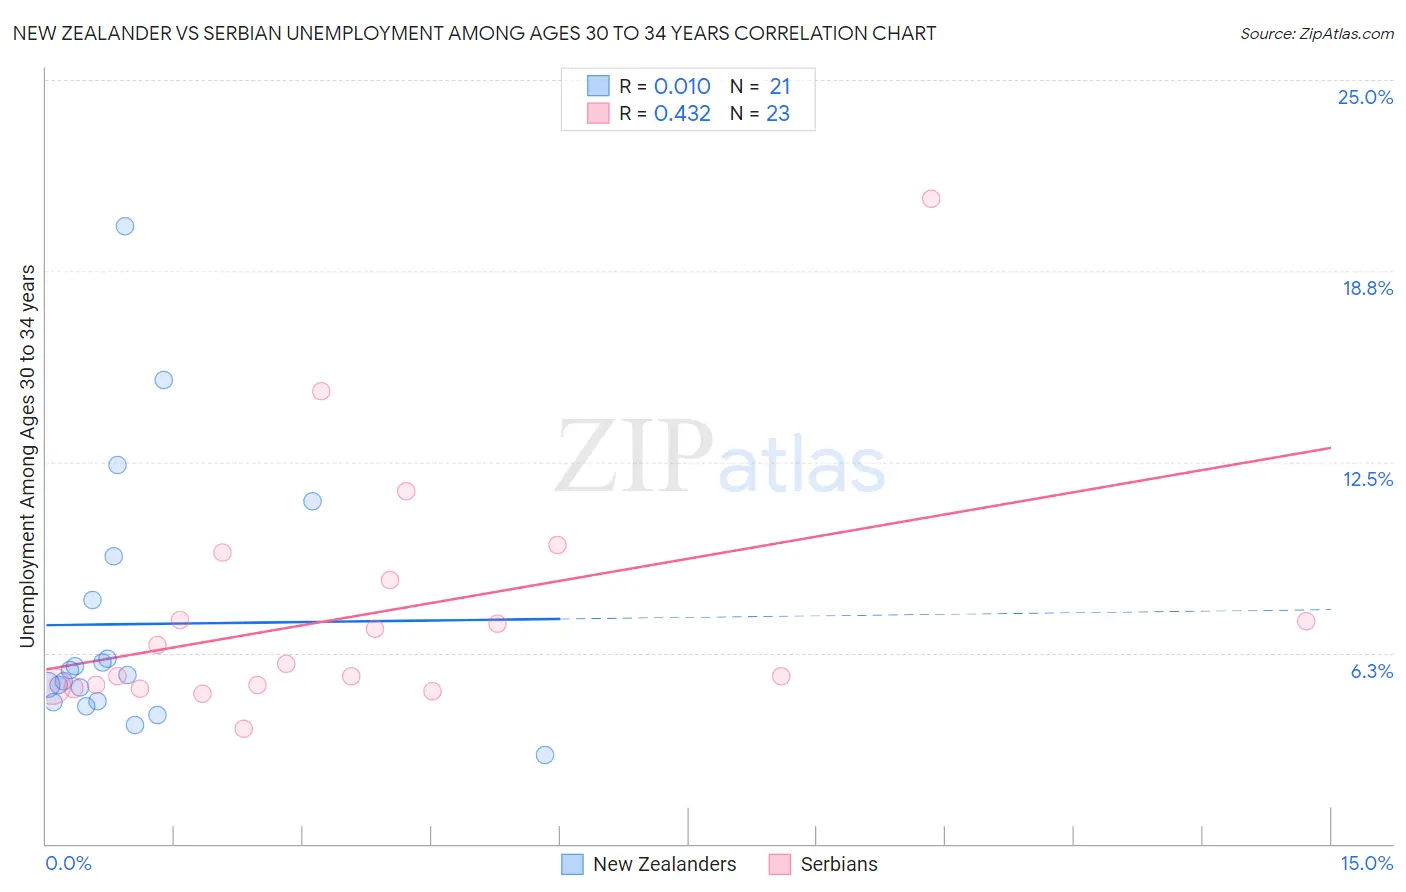
New Zealander vs Serbian Unemployment Among Ages 30 to 34 years Correlation Chart
The statistical analysis conducted on geographies consisting of 104,776,009 people shows no correlation between the proportion of New Zealanders and unemployment rate among population between the ages 30 and 34 in the United States with a correlation coefficient (R) of 0.010 and weighted average of 5.3%. Similarly, the statistical analysis conducted on geographies consisting of 254,966,443 people shows a moderate positive correlation between the proportion of Serbians and unemployment rate among population between the ages 30 and 34 in the United States with a correlation coefficient (R) of 0.432 and weighted average of 5.4%, a difference of 1.0%.
Unemployment Among Ages 30 to 34 years Correlation Summary
| Measurement | New Zealander | Serbian |
| Minimum | 2.9% | 3.8% |
| Maximum | 20.2% | 21.1% |
| Range | 17.3% | 17.3% |
| Mean | 7.2% | 7.5% |
| Median | 5.5% | 5.9% |
| Interquartile 25% (IQ1) | 4.6% | 5.2% |
| Interquartile 75% (IQ3) | 8.7% | 8.6% |
| Interquartile Range (IQR) | 4.0% | 3.5% |
| Standard Deviation (Sample) | 4.3% | 3.9% |
| Standard Deviation (Population) | 4.2% | 3.8% |
Demographics Similar to New Zealanders and Serbians by Unemployment Among Ages 30 to 34 years
In terms of unemployment among ages 30 to 34 years, the demographic groups most similar to New Zealanders are Immigrants from Poland (5.3%, a difference of 0.010%), Romanian (5.3%, a difference of 0.030%), Immigrants from South Africa (5.3%, a difference of 0.060%), Immigrants from Netherlands (5.3%, a difference of 0.080%), and Immigrants from Italy (5.3%, a difference of 0.17%). Similarly, the demographic groups most similar to Serbians are Immigrants from Canada (5.4%, a difference of 0.15%), Pakistani (5.4%, a difference of 0.16%), Palestinian (5.4%, a difference of 0.20%), Bangladeshi (5.3%, a difference of 0.34%), and Immigrants from Eastern Europe (5.3%, a difference of 0.42%).
| Demographics | Rating | Rank | Unemployment Among Ages 30 to 34 years |
| Immigrants | South Africa | 83.0 /100 | #118 | Excellent 5.3% |
| New Zealanders | 82.5 /100 | #119 | Excellent 5.3% |
| Immigrants | Poland | 82.4 /100 | #120 | Excellent 5.3% |
| Romanians | 82.3 /100 | #121 | Excellent 5.3% |
| Immigrants | Netherlands | 81.8 /100 | #122 | Excellent 5.3% |
| Immigrants | Italy | 81.1 /100 | #123 | Excellent 5.3% |
| Immigrants | Brazil | 80.8 /100 | #124 | Excellent 5.3% |
| Greeks | 80.4 /100 | #125 | Excellent 5.3% |
| Immigrants | Sri Lanka | 80.2 /100 | #126 | Excellent 5.3% |
| Taiwanese | 79.4 /100 | #127 | Good 5.3% |
| Immigrants | Uruguay | 79.3 /100 | #128 | Good 5.3% |
| Poles | 78.8 /100 | #129 | Good 5.3% |
| Germans | 77.8 /100 | #130 | Good 5.3% |
| Immigrants | Eastern Europe | 77.4 /100 | #131 | Good 5.3% |
| Carpatho Rusyns | 77.3 /100 | #132 | Good 5.3% |
| Immigrants | Northern Europe | 77.3 /100 | #133 | Good 5.3% |
| Bangladeshis | 76.6 /100 | #134 | Good 5.3% |
| Palestinians | 75.1 /100 | #135 | Good 5.4% |
| Pakistanis | 74.6 /100 | #136 | Good 5.4% |
| Immigrants | Canada | 74.6 /100 | #137 | Good 5.4% |
| Serbians | 72.9 /100 | #138 | Good 5.4% |