Colville vs Immigrants from Dominican Republic Unemployment
COMPARE
Colville
Immigrants from Dominican Republic
Unemployment
Unemployment Comparison
Colville
Immigrants from Dominican Republic
6.6%
UNEMPLOYMENT
0.0/ 100
METRIC RATING
312th/ 347
METRIC RANK
7.4%
UNEMPLOYMENT
0.0/ 100
METRIC RATING
333rd/ 347
METRIC RANK
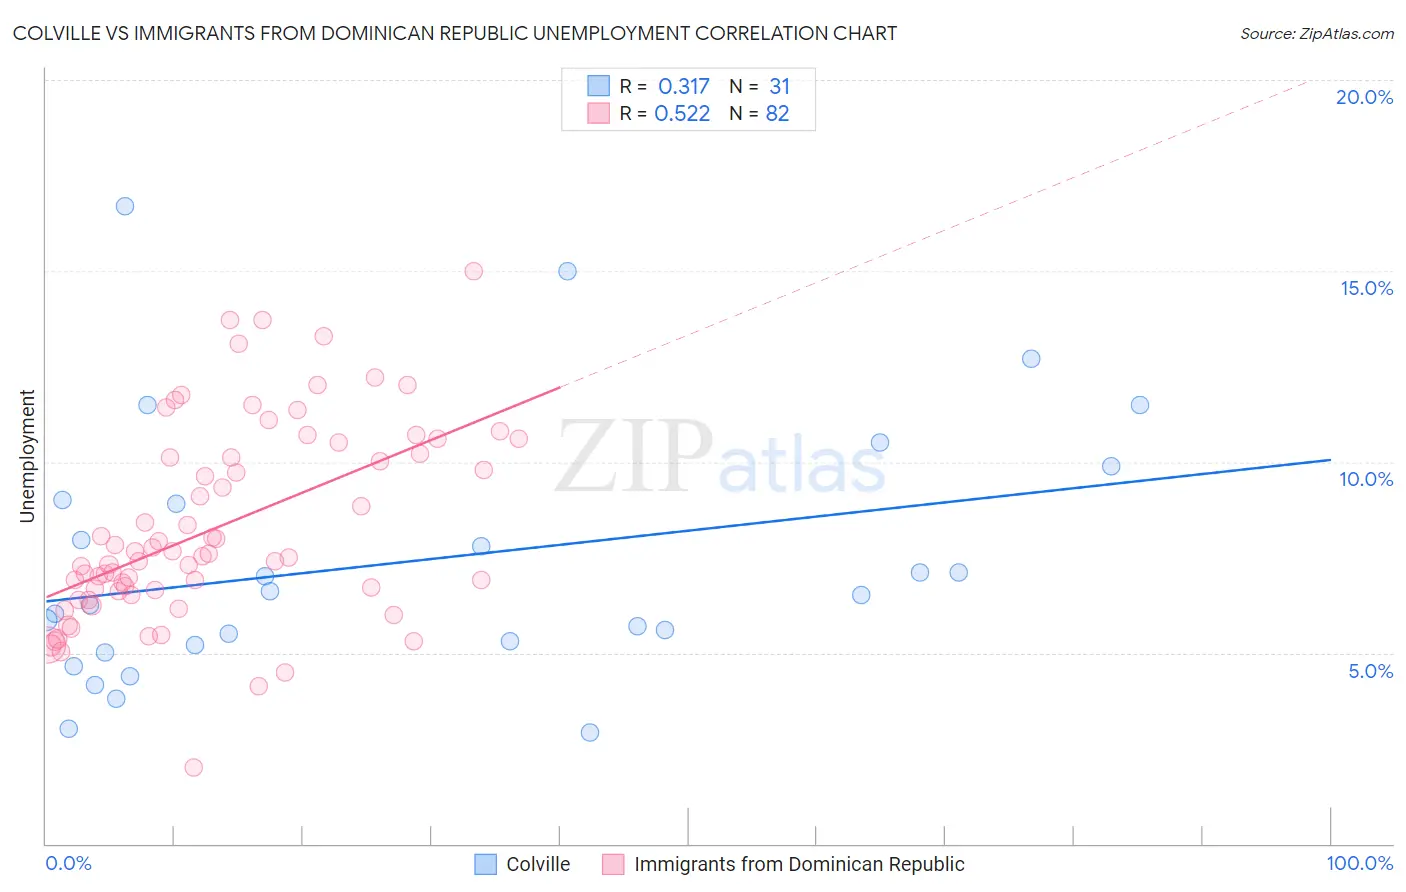
Colville vs Immigrants from Dominican Republic Unemployment Correlation Chart
The statistical analysis conducted on geographies consisting of 34,675,469 people shows a mild positive correlation between the proportion of Colville and unemployment in the United States with a correlation coefficient (R) of 0.317 and weighted average of 6.6%. Similarly, the statistical analysis conducted on geographies consisting of 274,892,404 people shows a substantial positive correlation between the proportion of Immigrants from Dominican Republic and unemployment in the United States with a correlation coefficient (R) of 0.522 and weighted average of 7.4%, a difference of 12.5%.
Unemployment Correlation Summary
| Measurement | Colville | Immigrants from Dominican Republic |
| Minimum | 2.9% | 2.0% |
| Maximum | 16.7% | 15.0% |
| Range | 13.8% | 13.0% |
| Mean | 7.4% | 8.3% |
| Median | 6.5% | 7.6% |
| Interquartile 25% (IQ1) | 5.2% | 6.6% |
| Interquartile 75% (IQ3) | 9.0% | 10.2% |
| Interquartile Range (IQR) | 3.8% | 3.6% |
| Standard Deviation (Sample) | 3.4% | 2.6% |
| Standard Deviation (Population) | 3.3% | 2.5% |
Similar Demographics by Unemployment
Demographics Similar to Colville by Unemployment
In terms of unemployment, the demographic groups most similar to Colville are Immigrants from Barbados (6.6%, a difference of 0.38%), Cape Verdean (6.5%, a difference of 0.57%), Immigrants from Belize (6.5%, a difference of 0.91%), Black/African American (6.6%, a difference of 0.93%), and Vietnamese (6.5%, a difference of 1.2%).
| Demographics | Rating | Rank | Unemployment |
| Menominee | 0.0 /100 | #305 | Tragic 6.4% |
| Lumbee | 0.0 /100 | #306 | Tragic 6.4% |
| Immigrants | Bangladesh | 0.0 /100 | #307 | Tragic 6.5% |
| Barbadians | 0.0 /100 | #308 | Tragic 6.5% |
| Vietnamese | 0.0 /100 | #309 | Tragic 6.5% |
| Immigrants | Belize | 0.0 /100 | #310 | Tragic 6.5% |
| Cape Verdeans | 0.0 /100 | #311 | Tragic 6.5% |
| Colville | 0.0 /100 | #312 | Tragic 6.6% |
| Immigrants | Barbados | 0.0 /100 | #313 | Tragic 6.6% |
| Blacks/African Americans | 0.0 /100 | #314 | Tragic 6.6% |
| Houma | 0.0 /100 | #315 | Tragic 6.7% |
| Immigrants | Dominica | 0.0 /100 | #316 | Tragic 6.7% |
| Shoshone | 0.0 /100 | #317 | Tragic 6.8% |
| Immigrants | Cabo Verde | 0.0 /100 | #318 | Tragic 6.8% |
| British West Indians | 0.0 /100 | #319 | Tragic 6.8% |
Demographics Similar to Immigrants from Dominican Republic by Unemployment
In terms of unemployment, the demographic groups most similar to Immigrants from Dominican Republic are Sioux (7.4%, a difference of 0.060%), Apache (7.4%, a difference of 0.47%), Dominican (7.4%, a difference of 0.48%), Yakama (7.3%, a difference of 0.82%), and Alaska Native (7.2%, a difference of 2.1%).
| Demographics | Rating | Rank | Unemployment |
| Paiute | 0.0 /100 | #326 | Tragic 7.1% |
| Pueblo | 0.0 /100 | #327 | Tragic 7.2% |
| Tsimshian | 0.0 /100 | #328 | Tragic 7.2% |
| Alaska Natives | 0.0 /100 | #329 | Tragic 7.2% |
| Yakama | 0.0 /100 | #330 | Tragic 7.3% |
| Dominicans | 0.0 /100 | #331 | Tragic 7.4% |
| Sioux | 0.0 /100 | #332 | Tragic 7.4% |
| Immigrants | Dominican Republic | 0.0 /100 | #333 | Tragic 7.4% |
| Apache | 0.0 /100 | #334 | Tragic 7.4% |
| Alaskan Athabascans | 0.0 /100 | #335 | Tragic 7.7% |
| Immigrants | Yemen | 0.0 /100 | #336 | Tragic 7.7% |
| Cheyenne | 0.0 /100 | #337 | Tragic 8.0% |
| Pima | 0.0 /100 | #338 | Tragic 8.2% |
| Navajo | 0.0 /100 | #339 | Tragic 8.4% |
| Puerto Ricans | 0.0 /100 | #340 | Tragic 8.4% |