Colville vs Immigrants from Dominican Republic No Vehicles in Household
COMPARE
Colville
Immigrants from Dominican Republic
No Vehicles in Household
No Vehicles in Household Comparison
Colville
Immigrants from Dominican Republic
13.7%
NO VEHICLES IN HOUSEHOLD
0.0/ 100
METRIC RATING
286th/ 347
METRIC RANK
31.4%
NO VEHICLES IN HOUSEHOLD
0.0/ 100
METRIC RATING
344th/ 347
METRIC RANK
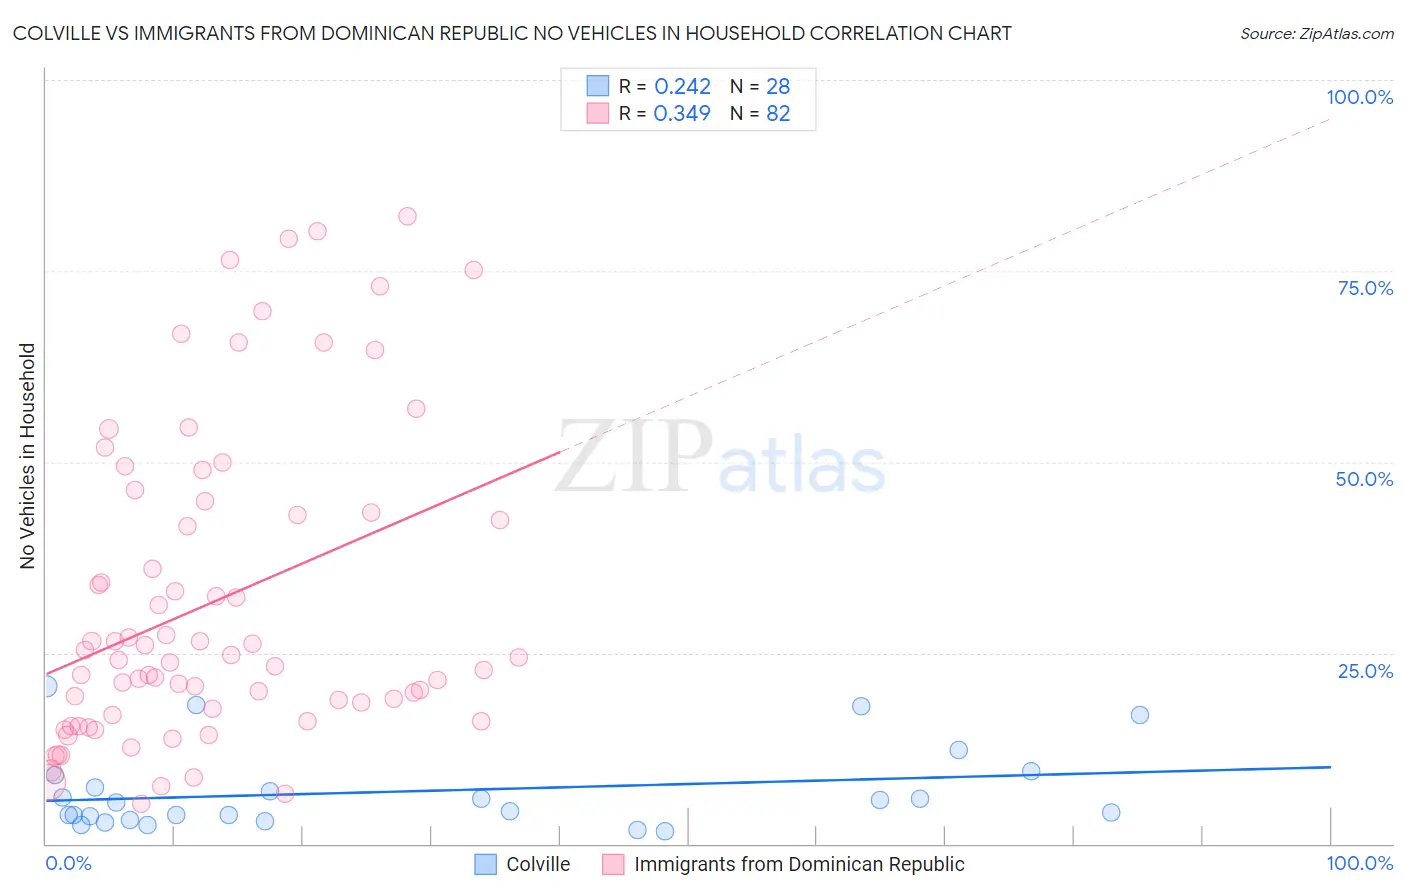
Colville vs Immigrants from Dominican Republic No Vehicles in Household Correlation Chart
The statistical analysis conducted on geographies consisting of 34,652,625 people shows a weak positive correlation between the proportion of Colville and percentage of households with no vehicle available in the United States with a correlation coefficient (R) of 0.242 and weighted average of 13.7%. Similarly, the statistical analysis conducted on geographies consisting of 274,700,556 people shows a mild positive correlation between the proportion of Immigrants from Dominican Republic and percentage of households with no vehicle available in the United States with a correlation coefficient (R) of 0.349 and weighted average of 31.4%, a difference of 129.6%.
No Vehicles in Household Correlation Summary
| Measurement | Colville | Immigrants from Dominican Republic |
| Minimum | 1.7% | 5.3% |
| Maximum | 20.7% | 82.1% |
| Range | 19.0% | 76.8% |
| Mean | 6.9% | 31.7% |
| Median | 4.9% | 24.2% |
| Interquartile 25% (IQ1) | 3.3% | 16.8% |
| Interquartile 75% (IQ3) | 8.2% | 43.3% |
| Interquartile Range (IQR) | 4.8% | 26.5% |
| Standard Deviation (Sample) | 5.4% | 20.3% |
| Standard Deviation (Population) | 5.3% | 20.2% |
Similar Demographics by No Vehicles in Household
Demographics Similar to Colville by No Vehicles in Household
In terms of no vehicles in household, the demographic groups most similar to Colville are Immigrants from Ireland (13.7%, a difference of 0.21%), Hopi (13.7%, a difference of 0.35%), Immigrants from Eastern Europe (13.6%, a difference of 0.66%), Immigrants from Malaysia (13.6%, a difference of 0.71%), and Immigrants from Kazakhstan (13.6%, a difference of 0.96%).
| Demographics | Rating | Rank | No Vehicles in Household |
| Mongolians | 0.0 /100 | #279 | Tragic 13.1% |
| Alsatians | 0.0 /100 | #280 | Tragic 13.2% |
| Central American Indians | 0.0 /100 | #281 | Tragic 13.3% |
| Immigrants | Eastern Asia | 0.0 /100 | #282 | Tragic 13.5% |
| Immigrants | Kazakhstan | 0.0 /100 | #283 | Tragic 13.6% |
| Immigrants | Malaysia | 0.0 /100 | #284 | Tragic 13.6% |
| Immigrants | Eastern Europe | 0.0 /100 | #285 | Tragic 13.6% |
| Colville | 0.0 /100 | #286 | Tragic 13.7% |
| Immigrants | Ireland | 0.0 /100 | #287 | Tragic 13.7% |
| Hopi | 0.0 /100 | #288 | Tragic 13.7% |
| Immigrants | Australia | 0.0 /100 | #289 | Tragic 13.8% |
| Indians (Asian) | 0.0 /100 | #290 | Tragic 14.1% |
| Okinawans | 0.0 /100 | #291 | Tragic 14.1% |
| Pima | 0.0 /100 | #292 | Tragic 14.1% |
| Immigrants | Jamaica | 0.0 /100 | #293 | Tragic 14.2% |
Demographics Similar to Immigrants from Dominican Republic by No Vehicles in Household
In terms of no vehicles in household, the demographic groups most similar to Immigrants from Dominican Republic are Inupiat (29.9%, a difference of 5.2%), British West Indian (29.7%, a difference of 5.7%), Immigrants from Guyana (29.5%, a difference of 6.6%), Immigrants from Barbados (29.5%, a difference of 6.6%), and Dominican (29.4%, a difference of 6.9%).
| Demographics | Rating | Rank | No Vehicles in Household |
| Immigrants | Trinidad and Tobago | 0.0 /100 | #333 | Tragic 24.6% |
| Immigrants | Bangladesh | 0.0 /100 | #334 | Tragic 25.8% |
| Barbadians | 0.0 /100 | #335 | Tragic 26.1% |
| Vietnamese | 0.0 /100 | #336 | Tragic 26.2% |
| Immigrants | Uzbekistan | 0.0 /100 | #337 | Tragic 26.7% |
| Guyanese | 0.0 /100 | #338 | Tragic 29.3% |
| Dominicans | 0.0 /100 | #339 | Tragic 29.4% |
| Immigrants | Barbados | 0.0 /100 | #340 | Tragic 29.5% |
| Immigrants | Guyana | 0.0 /100 | #341 | Tragic 29.5% |
| British West Indians | 0.0 /100 | #342 | Tragic 29.7% |
| Inupiat | 0.0 /100 | #343 | Tragic 29.9% |
| Immigrants | Dominican Republic | 0.0 /100 | #344 | Tragic 31.4% |
| Immigrants | St. Vincent and the Grenadines | 0.0 /100 | #345 | Tragic 35.4% |
| Immigrants | Grenada | 0.0 /100 | #346 | Tragic 37.5% |
| Yup'ik | 0.0 /100 | #347 | Tragic 45.9% |