Colombian vs Cree Unemployment Among Seniors over 75 years
COMPARE
Colombian
Cree
Unemployment Among Seniors over 75 years
Unemployment Among Seniors over 75 years Comparison
Colombians
Cree
8.5%
UNEMPLOYMENT AMONG SENIORS OVER 75 YEARS
86.7/ 100
METRIC RATING
144th/ 347
METRIC RANK
8.6%
UNEMPLOYMENT AMONG SENIORS OVER 75 YEARS
72.8/ 100
METRIC RATING
160th/ 347
METRIC RANK
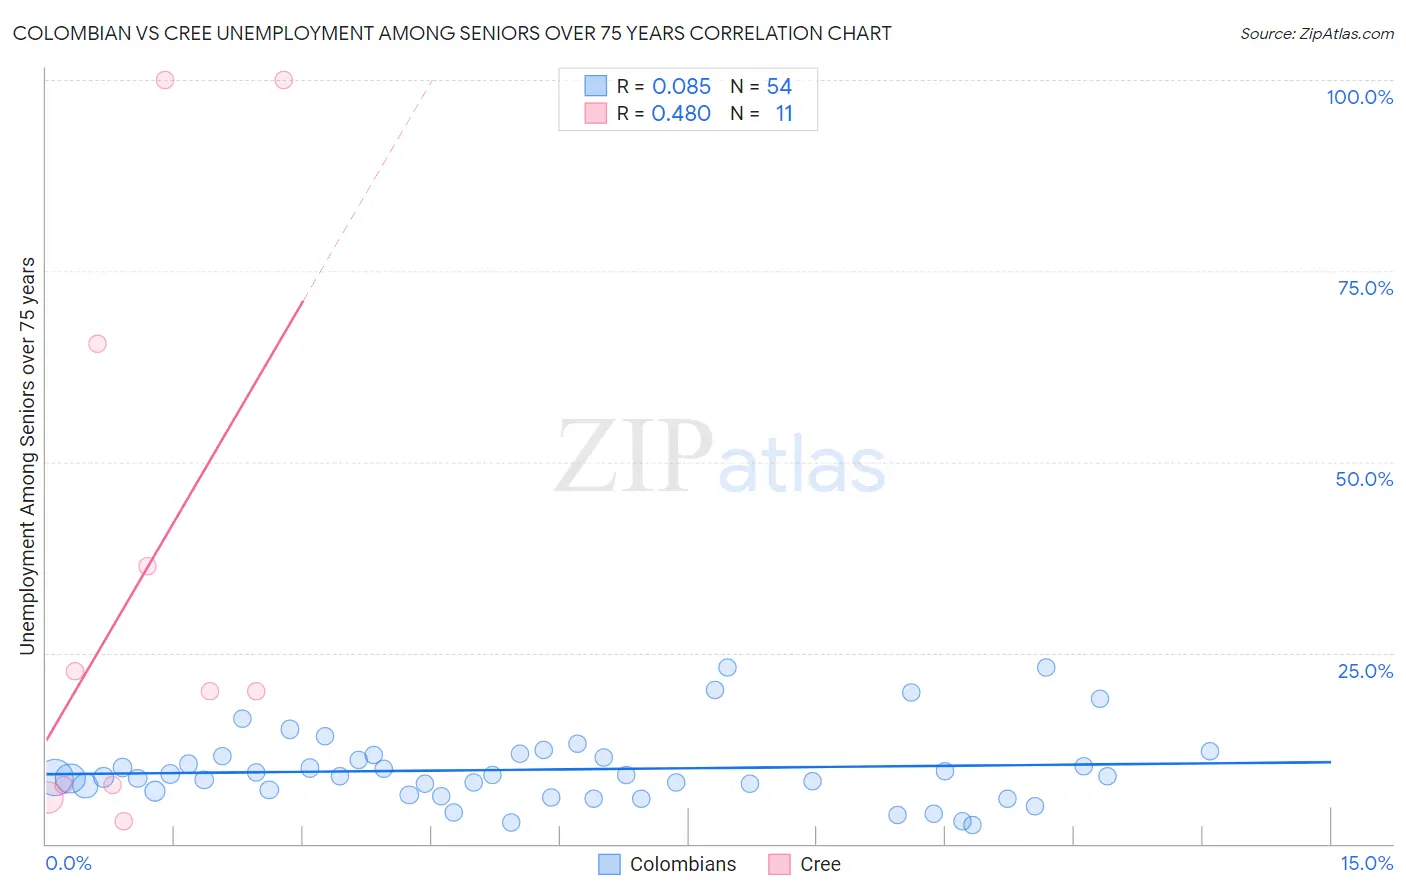
Colombian vs Cree Unemployment Among Seniors over 75 years Correlation Chart
The statistical analysis conducted on geographies consisting of 208,755,623 people shows a slight positive correlation between the proportion of Colombians and unemployment rate among seniors over the age of 75 in the United States with a correlation coefficient (R) of 0.085 and weighted average of 8.5%. Similarly, the statistical analysis conducted on geographies consisting of 59,192,461 people shows a moderate positive correlation between the proportion of Cree and unemployment rate among seniors over the age of 75 in the United States with a correlation coefficient (R) of 0.480 and weighted average of 8.6%, a difference of 1.2%.
Unemployment Among Seniors over 75 years Correlation Summary
| Measurement | Colombian | Cree |
| Minimum | 2.4% | 2.9% |
| Maximum | 23.1% | 100.0% |
| Range | 20.7% | 97.1% |
| Mean | 9.7% | 35.4% |
| Median | 8.8% | 20.0% |
| Interquartile 25% (IQ1) | 6.8% | 7.7% |
| Interquartile 75% (IQ3) | 11.5% | 65.5% |
| Interquartile Range (IQR) | 4.7% | 57.8% |
| Standard Deviation (Sample) | 4.7% | 36.5% |
| Standard Deviation (Population) | 4.7% | 34.8% |
Demographics Similar to Colombians and Cree by Unemployment Among Seniors over 75 years
In terms of unemployment among seniors over 75 years, the demographic groups most similar to Colombians are Immigrants from Costa Rica (8.5%, a difference of 0.010%), Immigrants from Ukraine (8.5%, a difference of 0.040%), Immigrants from Romania (8.5%, a difference of 0.060%), Immigrants from South Eastern Asia (8.5%, a difference of 0.11%), and Immigrants from Sierra Leone (8.5%, a difference of 0.13%). Similarly, the demographic groups most similar to Cree are Albanian (8.6%, a difference of 0.0%), Immigrants from South America (8.6%, a difference of 0.10%), Shoshone (8.6%, a difference of 0.12%), Ethiopian (8.6%, a difference of 0.17%), and Turkish (8.6%, a difference of 0.25%).
| Demographics | Rating | Rank | Unemployment Among Seniors over 75 years |
| Immigrants | Ukraine | 87.0 /100 | #142 | Excellent 8.5% |
| Immigrants | Costa Rica | 86.8 /100 | #143 | Excellent 8.5% |
| Colombians | 86.7 /100 | #144 | Excellent 8.5% |
| Immigrants | Romania | 86.2 /100 | #145 | Excellent 8.5% |
| Immigrants | South Eastern Asia | 85.8 /100 | #146 | Excellent 8.5% |
| Immigrants | Sierra Leone | 85.6 /100 | #147 | Excellent 8.5% |
| Immigrants | Colombia | 85.6 /100 | #148 | Excellent 8.5% |
| Immigrants | Ecuador | 84.6 /100 | #149 | Excellent 8.5% |
| Paiute | 82.5 /100 | #150 | Excellent 8.6% |
| Immigrants | Bosnia and Herzegovina | 80.6 /100 | #151 | Excellent 8.6% |
| Latvians | 80.5 /100 | #152 | Excellent 8.6% |
| Mongolians | 80.1 /100 | #153 | Excellent 8.6% |
| Immigrants | Pakistan | 79.7 /100 | #154 | Good 8.6% |
| Ecuadorians | 78.5 /100 | #155 | Good 8.6% |
| Immigrants | Bahamas | 76.5 /100 | #156 | Good 8.6% |
| Turks | 76.4 /100 | #157 | Good 8.6% |
| Ethiopians | 75.3 /100 | #158 | Good 8.6% |
| Shoshone | 74.6 /100 | #159 | Good 8.6% |
| Cree | 72.8 /100 | #160 | Good 8.6% |
| Albanians | 72.8 /100 | #161 | Good 8.6% |
| Immigrants | South America | 71.3 /100 | #162 | Good 8.6% |