Chippewa vs Liberian Unemployment Among Women with Children Under 18 years
COMPARE
Chippewa
Liberian
Unemployment Among Women with Children Under 18 years
Unemployment Among Women with Children Under 18 years Comparison
Chippewa
Liberians
7.0%
UNEMPLOYMENT AMONG WOMEN WITH CHILDREN UNDER 18 YEARS
0.0/ 100
METRIC RATING
326th/ 347
METRIC RANK
6.0%
UNEMPLOYMENT AMONG WOMEN WITH CHILDREN UNDER 18 YEARS
0.2/ 100
METRIC RATING
255th/ 347
METRIC RANK
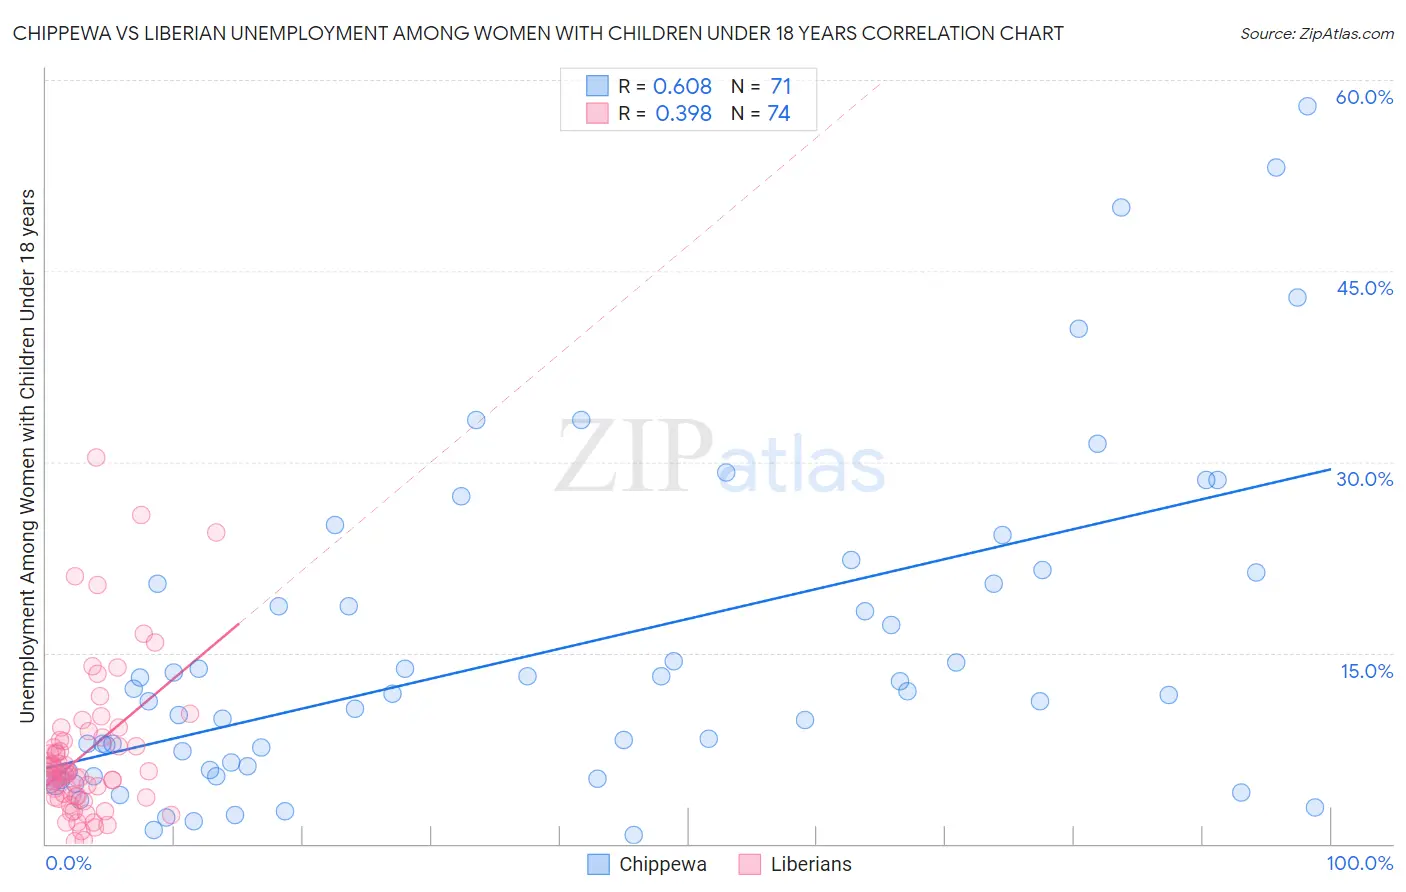
Chippewa vs Liberian Unemployment Among Women with Children Under 18 years Correlation Chart
The statistical analysis conducted on geographies consisting of 207,005,580 people shows a significant positive correlation between the proportion of Chippewa and unemployment rate among women with children under the age of 18 in the United States with a correlation coefficient (R) of 0.608 and weighted average of 7.0%. Similarly, the statistical analysis conducted on geographies consisting of 116,844,166 people shows a mild positive correlation between the proportion of Liberians and unemployment rate among women with children under the age of 18 in the United States with a correlation coefficient (R) of 0.398 and weighted average of 6.0%, a difference of 16.3%.
Unemployment Among Women with Children Under 18 years Correlation Summary
| Measurement | Chippewa | Liberian |
| Minimum | 0.70% | 0.20% |
| Maximum | 57.9% | 30.3% |
| Range | 57.2% | 30.1% |
| Mean | 15.0% | 7.2% |
| Median | 11.7% | 5.6% |
| Interquartile 25% (IQ1) | 5.7% | 3.7% |
| Interquartile 75% (IQ3) | 20.5% | 8.2% |
| Interquartile Range (IQR) | 14.7% | 4.5% |
| Standard Deviation (Sample) | 12.7% | 5.8% |
| Standard Deviation (Population) | 12.6% | 5.8% |
Similar Demographics by Unemployment Among Women with Children Under 18 years
Demographics Similar to Chippewa by Unemployment Among Women with Children Under 18 years
In terms of unemployment among women with children under 18 years, the demographic groups most similar to Chippewa are Immigrants from Dominica (7.0%, a difference of 0.71%), Lumbee (7.1%, a difference of 0.86%), Paiute (6.9%, a difference of 1.9%), Pueblo (6.8%, a difference of 2.9%), and Houma (6.8%, a difference of 3.1%).
| Demographics | Rating | Rank | Unemployment Among Women with Children Under 18 years |
| Central American Indians | 0.0 /100 | #319 | Tragic 6.7% |
| Immigrants | Belize | 0.0 /100 | #320 | Tragic 6.7% |
| U.S. Virgin Islanders | 0.0 /100 | #321 | Tragic 6.7% |
| Houma | 0.0 /100 | #322 | Tragic 6.8% |
| Pueblo | 0.0 /100 | #323 | Tragic 6.8% |
| Paiute | 0.0 /100 | #324 | Tragic 6.9% |
| Immigrants | Dominica | 0.0 /100 | #325 | Tragic 7.0% |
| Chippewa | 0.0 /100 | #326 | Tragic 7.0% |
| Lumbee | 0.0 /100 | #327 | Tragic 7.1% |
| Natives/Alaskans | 0.0 /100 | #328 | Tragic 7.2% |
| Blacks/African Americans | 0.0 /100 | #329 | Tragic 7.3% |
| Colville | 0.0 /100 | #330 | Tragic 7.4% |
| Hopi | 0.0 /100 | #331 | Tragic 7.4% |
| Dominicans | 0.0 /100 | #332 | Tragic 7.5% |
| Immigrants | Dominican Republic | 0.0 /100 | #333 | Tragic 7.5% |
Demographics Similar to Liberians by Unemployment Among Women with Children Under 18 years
In terms of unemployment among women with children under 18 years, the demographic groups most similar to Liberians are Nepalese (6.0%, a difference of 0.080%), Immigrants from the Azores (6.0%, a difference of 0.39%), Bermudan (6.1%, a difference of 0.61%), Immigrants from Nigeria (6.1%, a difference of 0.79%), and Immigrants from Congo (6.0%, a difference of 1.1%).
| Demographics | Rating | Rank | Unemployment Among Women with Children Under 18 years |
| Delaware | 0.8 /100 | #248 | Tragic 5.9% |
| Immigrants | Cameroon | 0.8 /100 | #249 | Tragic 5.9% |
| Immigrants | Cabo Verde | 0.7 /100 | #250 | Tragic 5.9% |
| Ute | 0.7 /100 | #251 | Tragic 5.9% |
| Seminole | 0.5 /100 | #252 | Tragic 6.0% |
| Immigrants | Congo | 0.4 /100 | #253 | Tragic 6.0% |
| Immigrants | Azores | 0.3 /100 | #254 | Tragic 6.0% |
| Liberians | 0.2 /100 | #255 | Tragic 6.0% |
| Nepalese | 0.2 /100 | #256 | Tragic 6.0% |
| Bermudans | 0.1 /100 | #257 | Tragic 6.1% |
| Immigrants | Nigeria | 0.1 /100 | #258 | Tragic 6.1% |
| Ottawa | 0.1 /100 | #259 | Tragic 6.1% |
| Nigerians | 0.1 /100 | #260 | Tragic 6.1% |
| Immigrants | Liberia | 0.1 /100 | #261 | Tragic 6.1% |
| Immigrants | Trinidad and Tobago | 0.1 /100 | #262 | Tragic 6.1% |