Chippewa vs Portuguese Unemployment Among Women with Children Under 18 years
COMPARE
Chippewa
Portuguese
Unemployment Among Women with Children Under 18 years
Unemployment Among Women with Children Under 18 years Comparison
Chippewa
Portuguese
7.0%
UNEMPLOYMENT AMONG WOMEN WITH CHILDREN UNDER 18 YEARS
0.0/ 100
METRIC RATING
326th/ 347
METRIC RANK
5.6%
UNEMPLOYMENT AMONG WOMEN WITH CHILDREN UNDER 18 YEARS
15.9/ 100
METRIC RATING
203rd/ 347
METRIC RANK
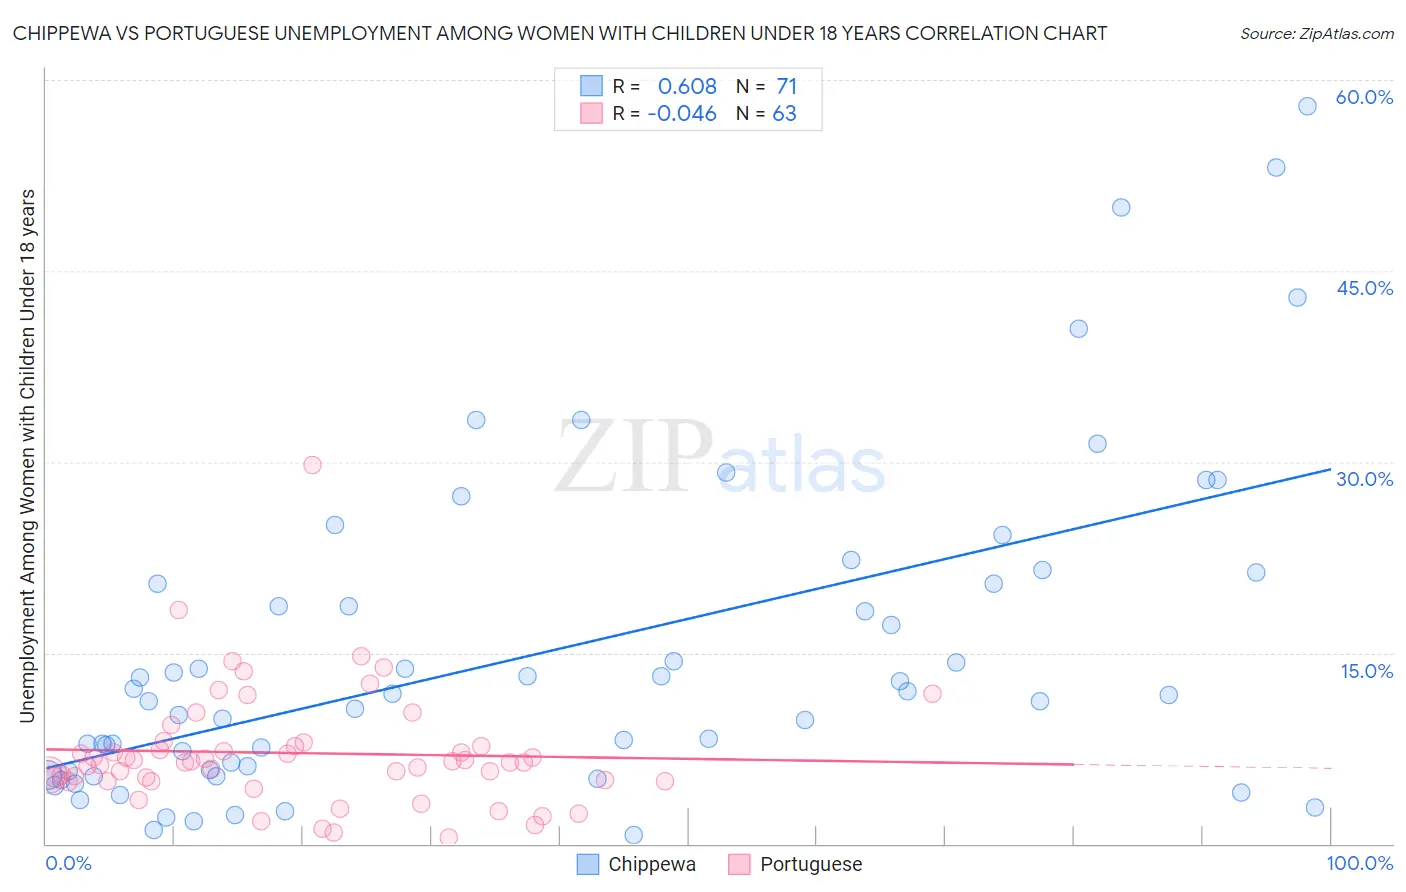
Chippewa vs Portuguese Unemployment Among Women with Children Under 18 years Correlation Chart
The statistical analysis conducted on geographies consisting of 207,005,580 people shows a significant positive correlation between the proportion of Chippewa and unemployment rate among women with children under the age of 18 in the United States with a correlation coefficient (R) of 0.608 and weighted average of 7.0%. Similarly, the statistical analysis conducted on geographies consisting of 426,366,108 people shows no correlation between the proportion of Portuguese and unemployment rate among women with children under the age of 18 in the United States with a correlation coefficient (R) of -0.046 and weighted average of 5.6%, a difference of 25.2%.
Unemployment Among Women with Children Under 18 years Correlation Summary
| Measurement | Chippewa | Portuguese |
| Minimum | 0.70% | 0.54% |
| Maximum | 57.9% | 29.7% |
| Range | 57.2% | 29.2% |
| Mean | 15.0% | 7.1% |
| Median | 11.7% | 6.4% |
| Interquartile 25% (IQ1) | 5.7% | 4.9% |
| Interquartile 75% (IQ3) | 20.5% | 7.7% |
| Interquartile Range (IQR) | 14.7% | 2.8% |
| Standard Deviation (Sample) | 12.7% | 4.6% |
| Standard Deviation (Population) | 12.6% | 4.6% |
Similar Demographics by Unemployment Among Women with Children Under 18 years
Demographics Similar to Chippewa by Unemployment Among Women with Children Under 18 years
In terms of unemployment among women with children under 18 years, the demographic groups most similar to Chippewa are Immigrants from Dominica (7.0%, a difference of 0.71%), Lumbee (7.1%, a difference of 0.86%), Paiute (6.9%, a difference of 1.9%), Pueblo (6.8%, a difference of 2.9%), and Houma (6.8%, a difference of 3.1%).
| Demographics | Rating | Rank | Unemployment Among Women with Children Under 18 years |
| Central American Indians | 0.0 /100 | #319 | Tragic 6.7% |
| Immigrants | Belize | 0.0 /100 | #320 | Tragic 6.7% |
| U.S. Virgin Islanders | 0.0 /100 | #321 | Tragic 6.7% |
| Houma | 0.0 /100 | #322 | Tragic 6.8% |
| Pueblo | 0.0 /100 | #323 | Tragic 6.8% |
| Paiute | 0.0 /100 | #324 | Tragic 6.9% |
| Immigrants | Dominica | 0.0 /100 | #325 | Tragic 7.0% |
| Chippewa | 0.0 /100 | #326 | Tragic 7.0% |
| Lumbee | 0.0 /100 | #327 | Tragic 7.1% |
| Natives/Alaskans | 0.0 /100 | #328 | Tragic 7.2% |
| Blacks/African Americans | 0.0 /100 | #329 | Tragic 7.3% |
| Colville | 0.0 /100 | #330 | Tragic 7.4% |
| Hopi | 0.0 /100 | #331 | Tragic 7.4% |
| Dominicans | 0.0 /100 | #332 | Tragic 7.5% |
| Immigrants | Dominican Republic | 0.0 /100 | #333 | Tragic 7.5% |
Demographics Similar to Portuguese by Unemployment Among Women with Children Under 18 years
In terms of unemployment among women with children under 18 years, the demographic groups most similar to Portuguese are Israeli (5.6%, a difference of 0.030%), Tsimshian (5.6%, a difference of 0.080%), Immigrants from Micronesia (5.6%, a difference of 0.15%), Immigrants from Morocco (5.6%, a difference of 0.24%), and Menominee (5.6%, a difference of 0.33%).
| Demographics | Rating | Rank | Unemployment Among Women with Children Under 18 years |
| Spaniards | 22.8 /100 | #196 | Fair 5.6% |
| Immigrants | Colombia | 21.4 /100 | #197 | Fair 5.6% |
| Arabs | 21.4 /100 | #198 | Fair 5.6% |
| Marshallese | 20.2 /100 | #199 | Fair 5.6% |
| Menominee | 18.6 /100 | #200 | Poor 5.6% |
| Immigrants | Morocco | 17.9 /100 | #201 | Poor 5.6% |
| Immigrants | Micronesia | 17.1 /100 | #202 | Poor 5.6% |
| Portuguese | 15.9 /100 | #203 | Poor 5.6% |
| Israelis | 15.6 /100 | #204 | Poor 5.6% |
| Tsimshian | 15.2 /100 | #205 | Poor 5.6% |
| Nicaraguans | 12.3 /100 | #206 | Poor 5.6% |
| Peruvians | 12.1 /100 | #207 | Poor 5.6% |
| Immigrants | Costa Rica | 11.6 /100 | #208 | Poor 5.6% |
| Immigrants | Western Asia | 11.3 /100 | #209 | Poor 5.6% |
| Immigrants | Nonimmigrants | 10.6 /100 | #210 | Poor 5.7% |