Immigrants from Costa Rica vs Alaskan Athabascan Unemployment Among Women with Children Under 18 years
COMPARE
Immigrants from Costa Rica
Alaskan Athabascan
Unemployment Among Women with Children Under 18 years
Unemployment Among Women with Children Under 18 years Comparison
Immigrants from Costa Rica
Alaskan Athabascans
5.6%
UNEMPLOYMENT AMONG WOMEN WITH CHILDREN UNDER 18 YEARS
11.6/ 100
METRIC RATING
208th/ 347
METRIC RANK
6.3%
UNEMPLOYMENT AMONG WOMEN WITH CHILDREN UNDER 18 YEARS
0.0/ 100
METRIC RATING
286th/ 347
METRIC RANK
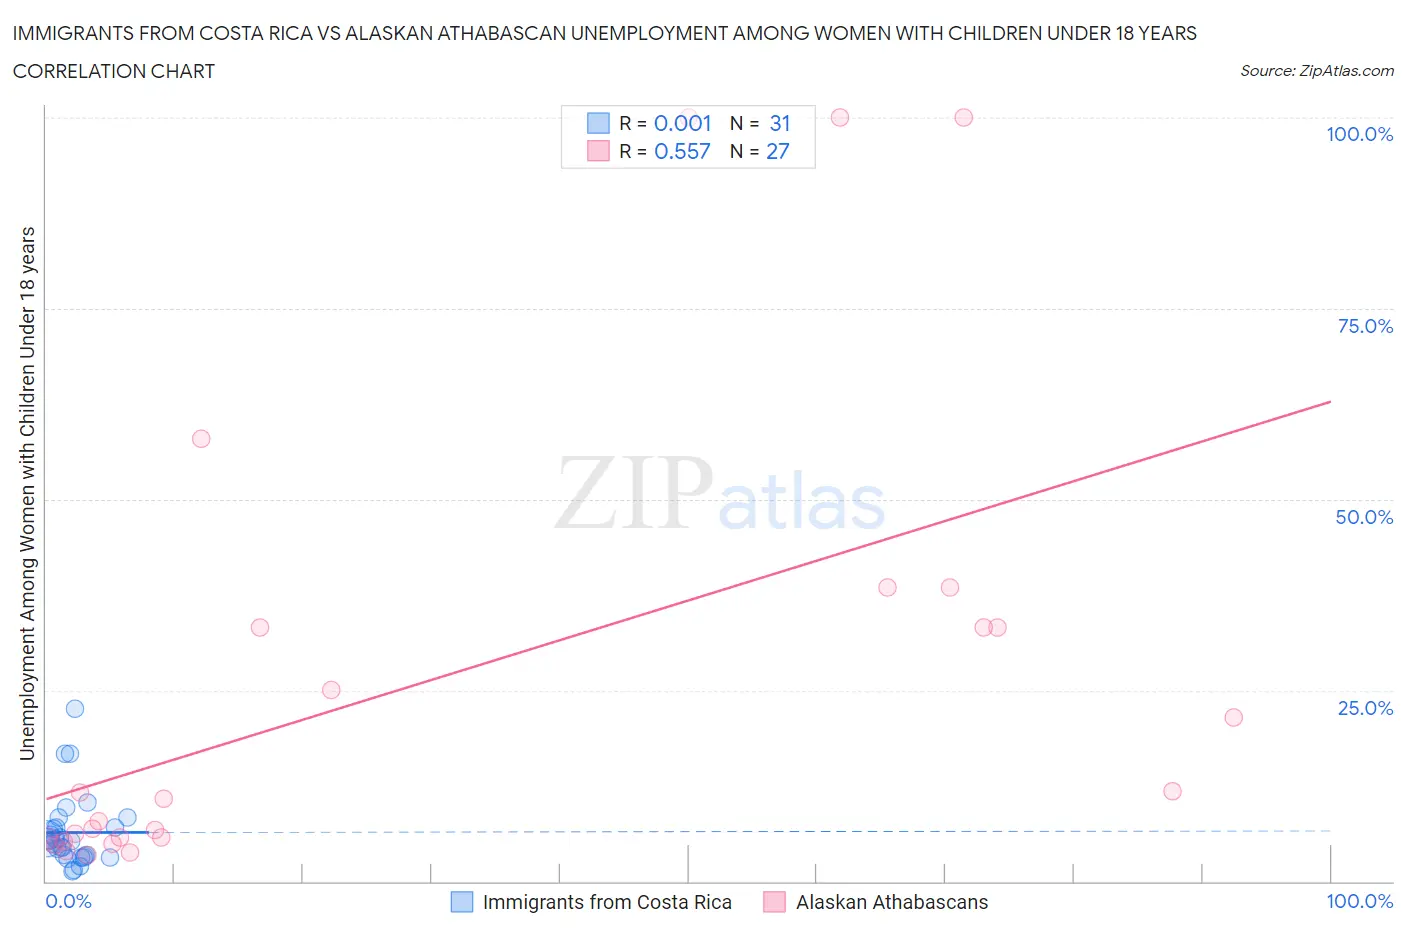
Immigrants from Costa Rica vs Alaskan Athabascan Unemployment Among Women with Children Under 18 years Correlation Chart
The statistical analysis conducted on geographies consisting of 201,252,028 people shows no correlation between the proportion of Immigrants from Costa Rica and unemployment rate among women with children under the age of 18 in the United States with a correlation coefficient (R) of 0.001 and weighted average of 5.6%. Similarly, the statistical analysis conducted on geographies consisting of 45,206,259 people shows a substantial positive correlation between the proportion of Alaskan Athabascans and unemployment rate among women with children under the age of 18 in the United States with a correlation coefficient (R) of 0.557 and weighted average of 6.3%, a difference of 12.2%.
Unemployment Among Women with Children Under 18 years Correlation Summary
| Measurement | Immigrants from Costa Rica | Alaskan Athabascan |
| Minimum | 1.3% | 3.4% |
| Maximum | 22.6% | 100.0% |
| Range | 21.3% | 96.6% |
| Mean | 6.4% | 25.4% |
| Median | 5.3% | 10.8% |
| Interquartile 25% (IQ1) | 3.3% | 5.6% |
| Interquartile 75% (IQ3) | 7.1% | 33.3% |
| Interquartile Range (IQR) | 3.8% | 27.7% |
| Standard Deviation (Sample) | 4.7% | 30.4% |
| Standard Deviation (Population) | 4.6% | 29.9% |
Similar Demographics by Unemployment Among Women with Children Under 18 years
Demographics Similar to Immigrants from Costa Rica by Unemployment Among Women with Children Under 18 years
In terms of unemployment among women with children under 18 years, the demographic groups most similar to Immigrants from Costa Rica are Immigrants from Western Asia (5.6%, a difference of 0.060%), Peruvian (5.6%, a difference of 0.080%), Nicaraguan (5.6%, a difference of 0.12%), Nonimmigrants (5.7%, a difference of 0.17%), and Panamanian (5.7%, a difference of 0.27%).
| Demographics | Rating | Rank | Unemployment Among Women with Children Under 18 years |
| Immigrants | Morocco | 17.9 /100 | #201 | Poor 5.6% |
| Immigrants | Micronesia | 17.1 /100 | #202 | Poor 5.6% |
| Portuguese | 15.9 /100 | #203 | Poor 5.6% |
| Israelis | 15.6 /100 | #204 | Poor 5.6% |
| Tsimshian | 15.2 /100 | #205 | Poor 5.6% |
| Nicaraguans | 12.3 /100 | #206 | Poor 5.6% |
| Peruvians | 12.1 /100 | #207 | Poor 5.6% |
| Immigrants | Costa Rica | 11.6 /100 | #208 | Poor 5.6% |
| Immigrants | Western Asia | 11.3 /100 | #209 | Poor 5.6% |
| Immigrants | Nonimmigrants | 10.6 /100 | #210 | Poor 5.7% |
| Panamanians | 10.1 /100 | #211 | Poor 5.7% |
| South Americans | 10.0 /100 | #212 | Poor 5.7% |
| Americans | 8.9 /100 | #213 | Tragic 5.7% |
| Japanese | 8.7 /100 | #214 | Tragic 5.7% |
| Immigrants | Uganda | 7.9 /100 | #215 | Tragic 5.7% |
Demographics Similar to Alaskan Athabascans by Unemployment Among Women with Children Under 18 years
In terms of unemployment among women with children under 18 years, the demographic groups most similar to Alaskan Athabascans are Kiowa (6.3%, a difference of 0.010%), Cree (6.3%, a difference of 0.13%), Bahamian (6.3%, a difference of 0.15%), Immigrants from Grenada (6.3%, a difference of 0.30%), and West Indian (6.3%, a difference of 0.33%).
| Demographics | Rating | Rank | Unemployment Among Women with Children Under 18 years |
| Immigrants | Portugal | 0.0 /100 | #279 | Tragic 6.3% |
| Guatemalans | 0.0 /100 | #280 | Tragic 6.3% |
| Immigrants | El Salvador | 0.0 /100 | #281 | Tragic 6.3% |
| Immigrants | St. Vincent and the Grenadines | 0.0 /100 | #282 | Tragic 6.3% |
| West Indians | 0.0 /100 | #283 | Tragic 6.3% |
| Immigrants | Grenada | 0.0 /100 | #284 | Tragic 6.3% |
| Bahamians | 0.0 /100 | #285 | Tragic 6.3% |
| Alaskan Athabascans | 0.0 /100 | #286 | Tragic 6.3% |
| Kiowa | 0.0 /100 | #287 | Tragic 6.3% |
| Cree | 0.0 /100 | #288 | Tragic 6.3% |
| Immigrants | Caribbean | 0.0 /100 | #289 | Tragic 6.4% |
| Blackfeet | 0.0 /100 | #290 | Tragic 6.4% |
| Immigrants | Guatemala | 0.0 /100 | #291 | Tragic 6.4% |
| Mexicans | 0.0 /100 | #292 | Tragic 6.4% |
| Immigrants | Bangladesh | 0.0 /100 | #293 | Tragic 6.4% |