Immigrants from Dominican Republic vs Immigrants from Japan Male Unemployment
COMPARE
Immigrants from Dominican Republic
Immigrants from Japan
Male Unemployment
Male Unemployment Comparison
Immigrants from Dominican Republic
Immigrants from Japan
7.6%
MALE UNEMPLOYMENT
0.0/ 100
METRIC RATING
326th/ 347
METRIC RANK
4.9%
MALE UNEMPLOYMENT
99.2/ 100
METRIC RATING
43rd/ 347
METRIC RANK
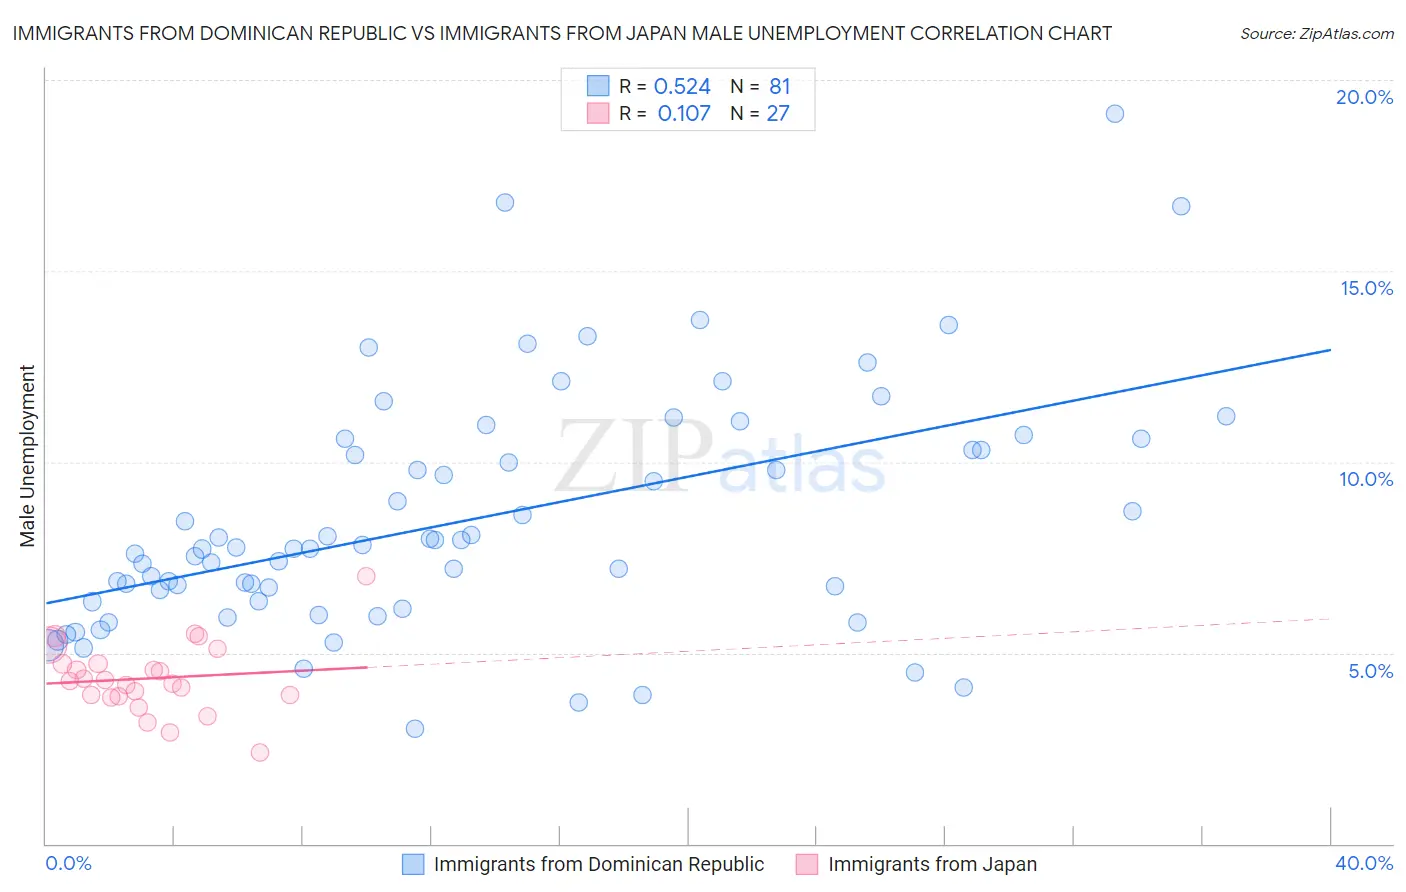
Immigrants from Dominican Republic vs Immigrants from Japan Male Unemployment Correlation Chart
The statistical analysis conducted on geographies consisting of 274,236,953 people shows a substantial positive correlation between the proportion of Immigrants from Dominican Republic and unemployment rate among males in the United States with a correlation coefficient (R) of 0.524 and weighted average of 7.6%. Similarly, the statistical analysis conducted on geographies consisting of 339,113,647 people shows a poor positive correlation between the proportion of Immigrants from Japan and unemployment rate among males in the United States with a correlation coefficient (R) of 0.107 and weighted average of 4.9%, a difference of 54.5%.
Male Unemployment Correlation Summary
| Measurement | Immigrants from Dominican Republic | Immigrants from Japan |
| Minimum | 3.0% | 2.4% |
| Maximum | 19.1% | 7.0% |
| Range | 16.1% | 4.6% |
| Mean | 8.5% | 4.3% |
| Median | 7.7% | 4.3% |
| Interquartile 25% (IQ1) | 6.3% | 3.8% |
| Interquartile 75% (IQ3) | 10.5% | 4.7% |
| Interquartile Range (IQR) | 4.1% | 0.88% |
| Standard Deviation (Sample) | 3.1% | 0.93% |
| Standard Deviation (Population) | 3.1% | 0.91% |
Similar Demographics by Male Unemployment
Demographics Similar to Immigrants from Dominican Republic by Male Unemployment
In terms of male unemployment, the demographic groups most similar to Immigrants from Dominican Republic are Shoshone (7.6%, a difference of 0.10%), Dominican (7.6%, a difference of 0.48%), Immigrants from Grenada (7.6%, a difference of 0.75%), Paiute (7.7%, a difference of 1.1%), and Native/Alaskan (7.7%, a difference of 1.5%).
| Demographics | Rating | Rank | Male Unemployment |
| British West Indians | 0.0 /100 | #319 | Tragic 7.3% |
| Colville | 0.0 /100 | #320 | Tragic 7.4% |
| Immigrants | St. Vincent and the Grenadines | 0.0 /100 | #321 | Tragic 7.5% |
| Immigrants | Cabo Verde | 0.0 /100 | #322 | Tragic 7.5% |
| Immigrants | Grenada | 0.0 /100 | #323 | Tragic 7.6% |
| Dominicans | 0.0 /100 | #324 | Tragic 7.6% |
| Shoshone | 0.0 /100 | #325 | Tragic 7.6% |
| Immigrants | Dominican Republic | 0.0 /100 | #326 | Tragic 7.6% |
| Paiute | 0.0 /100 | #327 | Tragic 7.7% |
| Natives/Alaskans | 0.0 /100 | #328 | Tragic 7.7% |
| Immigrants | Yemen | 0.0 /100 | #329 | Tragic 7.8% |
| Yakama | 0.0 /100 | #330 | Tragic 7.9% |
| Alaska Natives | 0.0 /100 | #331 | Tragic 8.1% |
| Pima | 0.0 /100 | #332 | Tragic 8.3% |
| Sioux | 0.0 /100 | #333 | Tragic 8.4% |
Demographics Similar to Immigrants from Japan by Male Unemployment
In terms of male unemployment, the demographic groups most similar to Immigrants from Japan are Immigrants from Belgium (4.9%, a difference of 0.10%), Chinese (4.9%, a difference of 0.13%), Immigrants from Korea (4.9%, a difference of 0.18%), Northern European (4.9%, a difference of 0.21%), and Burmese (4.9%, a difference of 0.29%).
| Demographics | Rating | Rank | Male Unemployment |
| Immigrants | Singapore | 99.4 /100 | #36 | Exceptional 4.9% |
| Scotch-Irish | 99.4 /100 | #37 | Exceptional 4.9% |
| Immigrants | Bosnia and Herzegovina | 99.4 /100 | #38 | Exceptional 4.9% |
| Burmese | 99.3 /100 | #39 | Exceptional 4.9% |
| Northern Europeans | 99.3 /100 | #40 | Exceptional 4.9% |
| Chinese | 99.3 /100 | #41 | Exceptional 4.9% |
| Immigrants | Belgium | 99.2 /100 | #42 | Exceptional 4.9% |
| Immigrants | Japan | 99.2 /100 | #43 | Exceptional 4.9% |
| Immigrants | Korea | 99.1 /100 | #44 | Exceptional 4.9% |
| Immigrants | Zimbabwe | 99.0 /100 | #45 | Exceptional 4.9% |
| Bhutanese | 98.9 /100 | #46 | Exceptional 4.9% |
| Austrians | 98.9 /100 | #47 | Exceptional 4.9% |
| Immigrants | Scotland | 98.9 /100 | #48 | Exceptional 4.9% |
| Poles | 98.9 /100 | #49 | Exceptional 4.9% |
| Croatians | 98.9 /100 | #50 | Exceptional 4.9% |