Chilean vs Bhutanese Unemployment Among Women with Children Under 6 years
COMPARE
Chilean
Bhutanese
Unemployment Among Women with Children Under 6 years
Unemployment Among Women with Children Under 6 years Comparison
Chileans
Bhutanese
7.2%
UNEMPLOYMENT AMONG WOMEN WITH CHILDREN UNDER 6 YEARS
97.4/ 100
METRIC RATING
101st/ 347
METRIC RANK
6.7%
UNEMPLOYMENT AMONG WOMEN WITH CHILDREN UNDER 6 YEARS
99.9/ 100
METRIC RATING
43rd/ 347
METRIC RANK
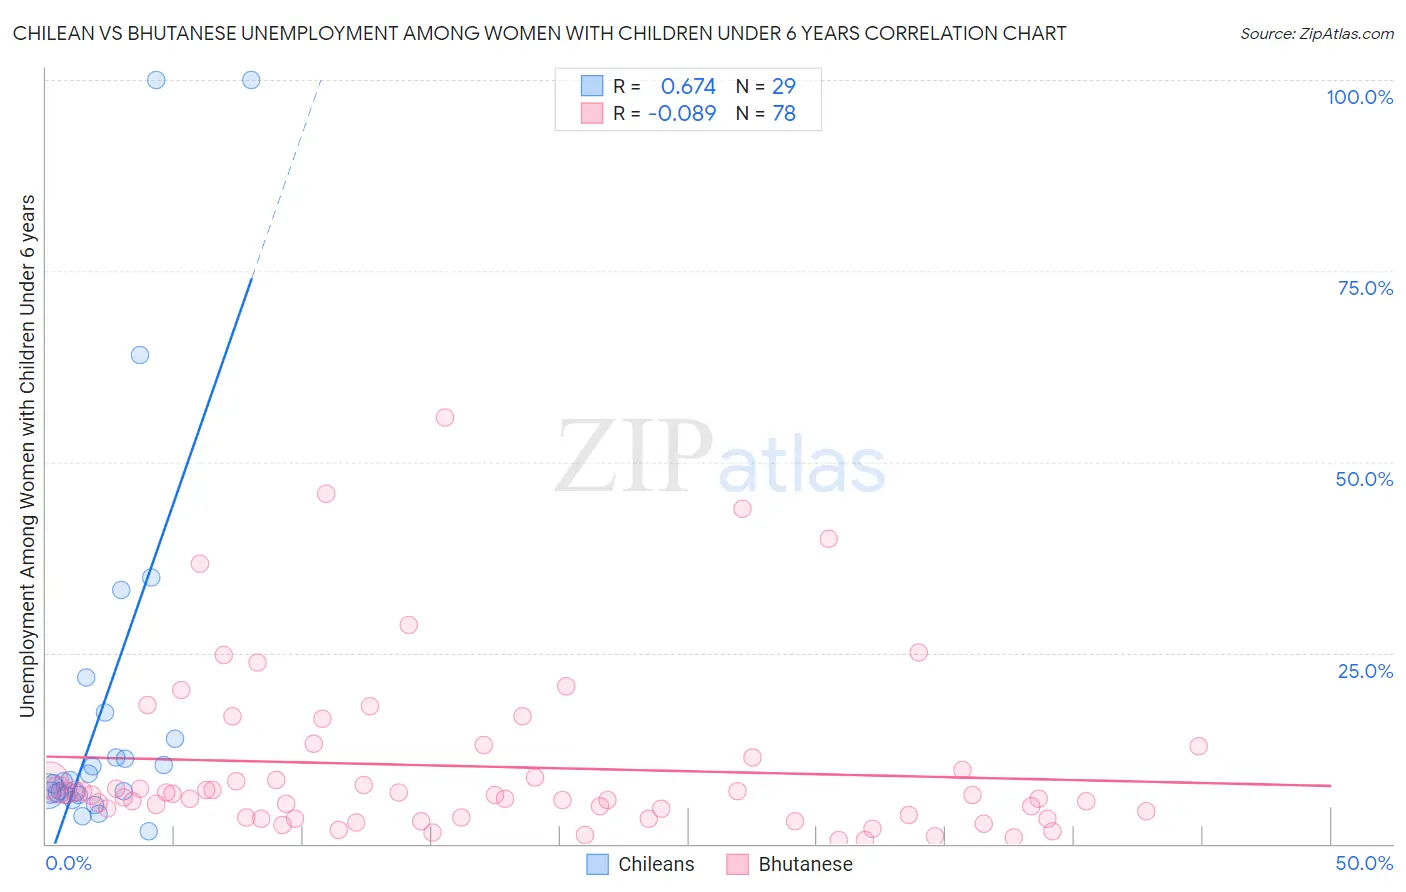
Chilean vs Bhutanese Unemployment Among Women with Children Under 6 years Correlation Chart
The statistical analysis conducted on geographies consisting of 212,235,383 people shows a significant positive correlation between the proportion of Chileans and unemployment rate among women with children under the age of 6 in the United States with a correlation coefficient (R) of 0.674 and weighted average of 7.2%. Similarly, the statistical analysis conducted on geographies consisting of 334,834,732 people shows a slight negative correlation between the proportion of Bhutanese and unemployment rate among women with children under the age of 6 in the United States with a correlation coefficient (R) of -0.089 and weighted average of 6.7%, a difference of 7.1%.
Unemployment Among Women with Children Under 6 years Correlation Summary
| Measurement | Chilean | Bhutanese |
| Minimum | 1.6% | 0.50% |
| Maximum | 100.0% | 55.8% |
| Range | 98.4% | 55.3% |
| Mean | 18.4% | 10.1% |
| Median | 8.2% | 6.4% |
| Interquartile 25% (IQ1) | 6.5% | 3.4% |
| Interquartile 75% (IQ3) | 15.5% | 11.3% |
| Interquartile Range (IQR) | 9.0% | 7.9% |
| Standard Deviation (Sample) | 25.8% | 11.0% |
| Standard Deviation (Population) | 25.4% | 11.0% |
Similar Demographics by Unemployment Among Women with Children Under 6 years
Demographics Similar to Chileans by Unemployment Among Women with Children Under 6 years
In terms of unemployment among women with children under 6 years, the demographic groups most similar to Chileans are Immigrants from Northern Europe (7.2%, a difference of 0.020%), Immigrants from Nicaragua (7.2%, a difference of 0.030%), Immigrants from Saudi Arabia (7.2%, a difference of 0.030%), Immigrants from Europe (7.2%, a difference of 0.070%), and Russian (7.2%, a difference of 0.11%).
| Demographics | Rating | Rank | Unemployment Among Women with Children Under 6 years |
| Macedonians | 97.7 /100 | #94 | Exceptional 7.2% |
| Romanians | 97.7 /100 | #95 | Exceptional 7.2% |
| Immigrants | Eastern Africa | 97.7 /100 | #96 | Exceptional 7.2% |
| Immigrants | South Eastern Asia | 97.6 /100 | #97 | Exceptional 7.2% |
| Russians | 97.5 /100 | #98 | Exceptional 7.2% |
| Immigrants | Europe | 97.5 /100 | #99 | Exceptional 7.2% |
| Immigrants | Northern Europe | 97.4 /100 | #100 | Exceptional 7.2% |
| Chileans | 97.4 /100 | #101 | Exceptional 7.2% |
| Immigrants | Nicaragua | 97.3 /100 | #102 | Exceptional 7.2% |
| Immigrants | Saudi Arabia | 97.3 /100 | #103 | Exceptional 7.2% |
| Immigrants | Egypt | 97.2 /100 | #104 | Exceptional 7.2% |
| Venezuelans | 97.2 /100 | #105 | Exceptional 7.2% |
| Immigrants | Pakistan | 97.2 /100 | #106 | Exceptional 7.2% |
| Immigrants | Kazakhstan | 97.1 /100 | #107 | Exceptional 7.2% |
| Eastern Europeans | 96.9 /100 | #108 | Exceptional 7.2% |
Demographics Similar to Bhutanese by Unemployment Among Women with Children Under 6 years
In terms of unemployment among women with children under 6 years, the demographic groups most similar to Bhutanese are Immigrants from Cuba (6.7%, a difference of 0.28%), Immigrants from Indonesia (6.7%, a difference of 0.38%), Asian (6.7%, a difference of 0.54%), Iranian (6.7%, a difference of 0.55%), and Immigrants from Australia (6.8%, a difference of 0.61%).
| Demographics | Rating | Rank | Unemployment Among Women with Children Under 6 years |
| Luxembourgers | 100.0 /100 | #36 | Exceptional 6.6% |
| Sri Lankans | 100.0 /100 | #37 | Exceptional 6.6% |
| Hmong | 100.0 /100 | #38 | Exceptional 6.7% |
| Immigrants | Russia | 100.0 /100 | #39 | Exceptional 6.7% |
| Asians | 100.0 /100 | #40 | Exceptional 6.7% |
| Immigrants | Indonesia | 99.9 /100 | #41 | Exceptional 6.7% |
| Immigrants | Cuba | 99.9 /100 | #42 | Exceptional 6.7% |
| Bhutanese | 99.9 /100 | #43 | Exceptional 6.7% |
| Iranians | 99.9 /100 | #44 | Exceptional 6.7% |
| Immigrants | Australia | 99.9 /100 | #45 | Exceptional 6.8% |
| Latvians | 99.9 /100 | #46 | Exceptional 6.8% |
| Immigrants | Asia | 99.9 /100 | #47 | Exceptional 6.8% |
| Immigrants | Switzerland | 99.9 /100 | #48 | Exceptional 6.8% |
| Immigrants | Nepal | 99.9 /100 | #49 | Exceptional 6.8% |
| Immigrants | Ireland | 99.9 /100 | #50 | Exceptional 6.8% |