Cherokee vs Immigrants from Western Europe Female Unemployment
COMPARE
Cherokee
Immigrants from Western Europe
Female Unemployment
Female Unemployment Comparison
Cherokee
Immigrants from Western Europe
5.3%
FEMALE UNEMPLOYMENT
30.8/ 100
METRIC RATING
191st/ 347
METRIC RANK
5.1%
FEMALE UNEMPLOYMENT
88.1/ 100
METRIC RATING
121st/ 347
METRIC RANK
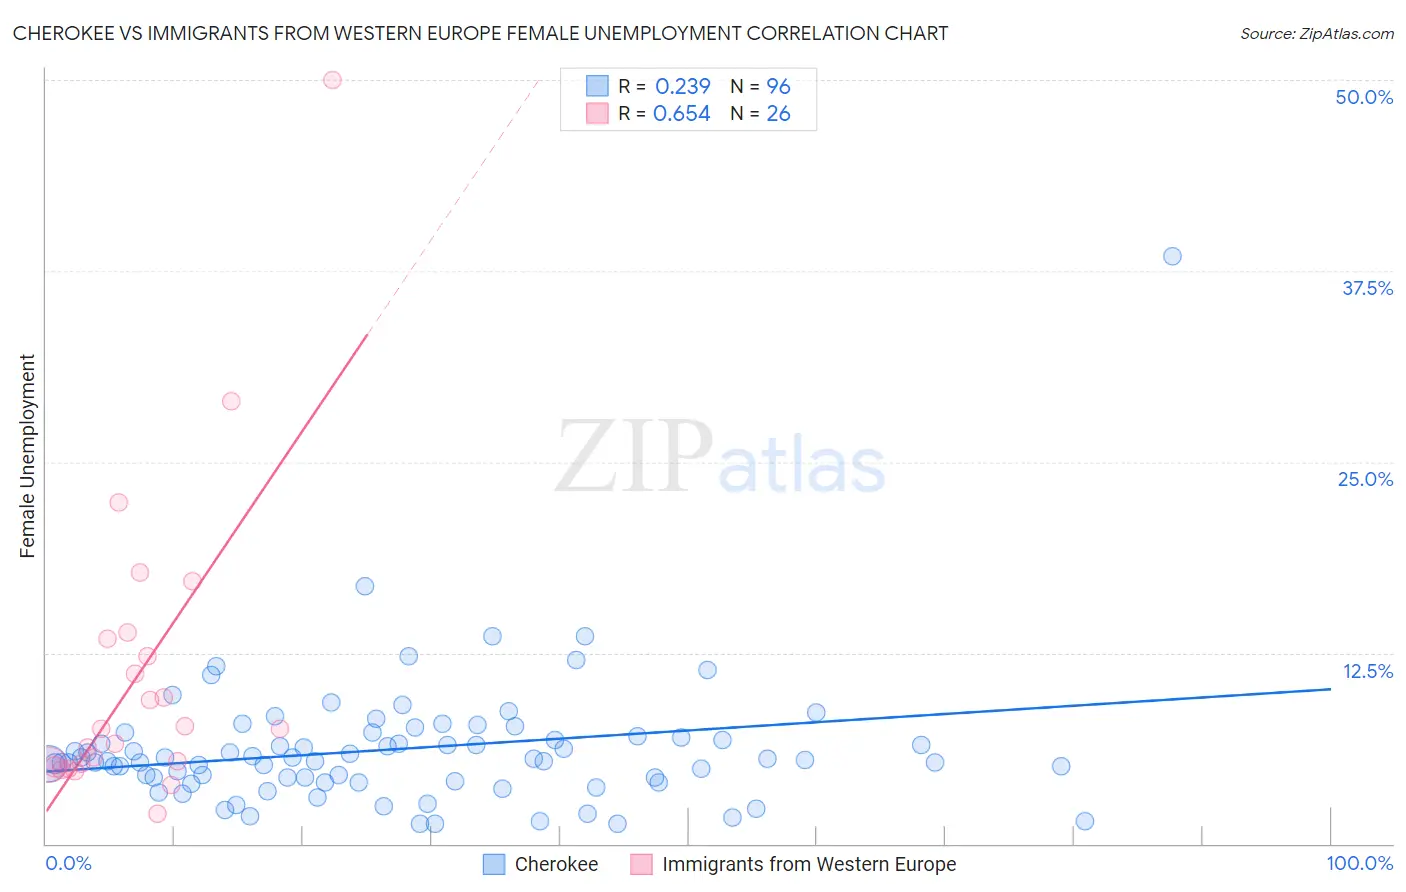
Cherokee vs Immigrants from Western Europe Female Unemployment Correlation Chart
The statistical analysis conducted on geographies consisting of 487,346,923 people shows a weak positive correlation between the proportion of Cherokee and unemploymnet rate among females in the United States with a correlation coefficient (R) of 0.239 and weighted average of 5.3%. Similarly, the statistical analysis conducted on geographies consisting of 489,098,257 people shows a significant positive correlation between the proportion of Immigrants from Western Europe and unemploymnet rate among females in the United States with a correlation coefficient (R) of 0.654 and weighted average of 5.1%, a difference of 4.4%.
Female Unemployment Correlation Summary
| Measurement | Cherokee | Immigrants from Western Europe |
| Minimum | 1.3% | 2.0% |
| Maximum | 38.5% | 50.0% |
| Range | 37.2% | 48.0% |
| Mean | 6.2% | 11.1% |
| Median | 5.5% | 7.5% |
| Interquartile 25% (IQ1) | 4.2% | 5.2% |
| Interquartile 75% (IQ3) | 7.0% | 13.4% |
| Interquartile Range (IQR) | 2.8% | 8.2% |
| Standard Deviation (Sample) | 4.4% | 10.1% |
| Standard Deviation (Population) | 4.4% | 9.9% |
Similar Demographics by Female Unemployment
Demographics Similar to Cherokee by Female Unemployment
In terms of female unemployment, the demographic groups most similar to Cherokee are Ugandan (5.3%, a difference of 0.030%), Portuguese (5.3%, a difference of 0.16%), Costa Rican (5.3%, a difference of 0.20%), Afghan (5.3%, a difference of 0.21%), and Arab (5.3%, a difference of 0.23%).
| Demographics | Rating | Rank | Female Unemployment |
| Immigrants | Ukraine | 40.1 /100 | #184 | Average 5.3% |
| Malaysians | 40.1 /100 | #185 | Average 5.3% |
| Immigrants | Belarus | 39.4 /100 | #186 | Fair 5.3% |
| Immigrants | Albania | 35.4 /100 | #187 | Fair 5.3% |
| Afghans | 33.9 /100 | #188 | Fair 5.3% |
| Costa Ricans | 33.8 /100 | #189 | Fair 5.3% |
| Ugandans | 31.2 /100 | #190 | Fair 5.3% |
| Cherokee | 30.8 /100 | #191 | Fair 5.3% |
| Portuguese | 28.6 /100 | #192 | Fair 5.3% |
| Arabs | 27.7 /100 | #193 | Fair 5.3% |
| Colombians | 27.0 /100 | #194 | Fair 5.3% |
| Immigrants | Colombia | 26.2 /100 | #195 | Fair 5.3% |
| Spaniards | 25.2 /100 | #196 | Fair 5.3% |
| Alsatians | 23.9 /100 | #197 | Fair 5.3% |
| Tsimshian | 23.1 /100 | #198 | Fair 5.4% |
Demographics Similar to Immigrants from Western Europe by Female Unemployment
In terms of female unemployment, the demographic groups most similar to Immigrants from Western Europe are Immigrants from Romania (5.1%, a difference of 0.0%), Immigrants from North Macedonia (5.1%, a difference of 0.030%), Immigrants from Germany (5.1%, a difference of 0.080%), Immigrants from South Africa (5.1%, a difference of 0.080%), and Immigrants from Europe (5.1%, a difference of 0.13%).
| Demographics | Rating | Rank | Female Unemployment |
| Immigrants | Turkey | 91.0 /100 | #114 | Exceptional 5.1% |
| Lebanese | 91.0 /100 | #115 | Exceptional 5.1% |
| Americans | 90.5 /100 | #116 | Exceptional 5.1% |
| Jordanians | 90.3 /100 | #117 | Exceptional 5.1% |
| Immigrants | Croatia | 89.9 /100 | #118 | Excellent 5.1% |
| Immigrants | North Macedonia | 88.3 /100 | #119 | Excellent 5.1% |
| Immigrants | Romania | 88.1 /100 | #120 | Excellent 5.1% |
| Immigrants | Western Europe | 88.1 /100 | #121 | Excellent 5.1% |
| Immigrants | Germany | 87.6 /100 | #122 | Excellent 5.1% |
| Immigrants | South Africa | 87.6 /100 | #123 | Excellent 5.1% |
| Immigrants | Europe | 87.2 /100 | #124 | Excellent 5.1% |
| Basques | 86.5 /100 | #125 | Excellent 5.1% |
| Immigrants | Korea | 86.3 /100 | #126 | Excellent 5.1% |
| Immigrants | Hungary | 86.0 /100 | #127 | Excellent 5.1% |
| Chileans | 85.8 /100 | #128 | Excellent 5.1% |