Cherokee vs Ghanaian Unemployment Among Women with Children Under 6 years
COMPARE
Cherokee
Ghanaian
Unemployment Among Women with Children Under 6 years
Unemployment Among Women with Children Under 6 years Comparison
Cherokee
Ghanaians
9.3%
UNEMPLOYMENT AMONG WOMEN WITH CHILDREN UNDER 6 YEARS
0.0/ 100
METRIC RATING
315th/ 347
METRIC RANK
8.2%
UNEMPLOYMENT AMONG WOMEN WITH CHILDREN UNDER 6 YEARS
1.0/ 100
METRIC RATING
252nd/ 347
METRIC RANK
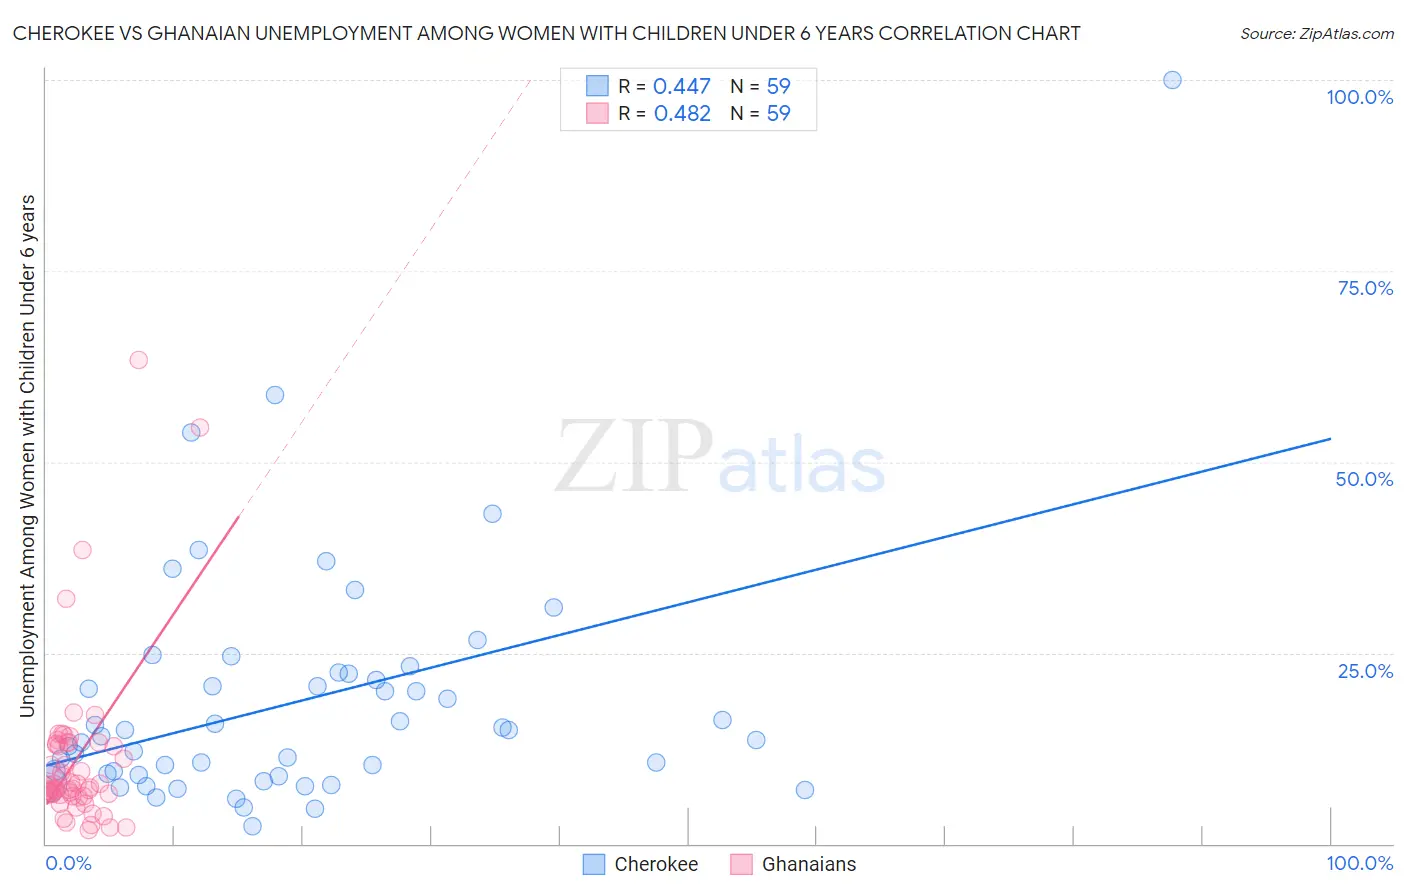
Cherokee vs Ghanaian Unemployment Among Women with Children Under 6 years Correlation Chart
The statistical analysis conducted on geographies consisting of 349,052,649 people shows a moderate positive correlation between the proportion of Cherokee and unemployment rate among women with children under the age of 6 in the United States with a correlation coefficient (R) of 0.447 and weighted average of 9.3%. Similarly, the statistical analysis conducted on geographies consisting of 165,389,442 people shows a moderate positive correlation between the proportion of Ghanaians and unemployment rate among women with children under the age of 6 in the United States with a correlation coefficient (R) of 0.482 and weighted average of 8.2%, a difference of 13.3%.
Unemployment Among Women with Children Under 6 years Correlation Summary
| Measurement | Cherokee | Ghanaian |
| Minimum | 2.3% | 1.8% |
| Maximum | 100.0% | 63.4% |
| Range | 97.7% | 61.6% |
| Mean | 18.6% | 11.0% |
| Median | 14.1% | 7.6% |
| Interquartile 25% (IQ1) | 9.0% | 6.5% |
| Interquartile 75% (IQ3) | 22.2% | 13.2% |
| Interquartile Range (IQR) | 13.2% | 6.7% |
| Standard Deviation (Sample) | 15.9% | 11.0% |
| Standard Deviation (Population) | 15.8% | 10.9% |
Similar Demographics by Unemployment Among Women with Children Under 6 years
Demographics Similar to Cherokee by Unemployment Among Women with Children Under 6 years
In terms of unemployment among women with children under 6 years, the demographic groups most similar to Cherokee are Fijian (9.3%, a difference of 0.78%), Houma (9.4%, a difference of 0.78%), American (9.3%, a difference of 0.80%), Immigrants from the Azores (9.2%, a difference of 1.2%), and French American Indian (9.2%, a difference of 1.4%).
| Demographics | Rating | Rank | Unemployment Among Women with Children Under 6 years |
| Immigrants | Micronesia | 0.0 /100 | #308 | Tragic 9.1% |
| Africans | 0.0 /100 | #309 | Tragic 9.2% |
| Cajuns | 0.0 /100 | #310 | Tragic 9.2% |
| French American Indians | 0.0 /100 | #311 | Tragic 9.2% |
| Immigrants | Azores | 0.0 /100 | #312 | Tragic 9.2% |
| Americans | 0.0 /100 | #313 | Tragic 9.3% |
| Fijians | 0.0 /100 | #314 | Tragic 9.3% |
| Cherokee | 0.0 /100 | #315 | Tragic 9.3% |
| Houma | 0.0 /100 | #316 | Tragic 9.4% |
| Dutch West Indians | 0.0 /100 | #317 | Tragic 9.5% |
| Osage | 0.0 /100 | #318 | Tragic 9.5% |
| Marshallese | 0.0 /100 | #319 | Tragic 9.6% |
| Potawatomi | 0.0 /100 | #320 | Tragic 9.6% |
| Central American Indians | 0.0 /100 | #321 | Tragic 9.6% |
| Alaska Natives | 0.0 /100 | #322 | Tragic 9.6% |
Demographics Similar to Ghanaians by Unemployment Among Women with Children Under 6 years
In terms of unemployment among women with children under 6 years, the demographic groups most similar to Ghanaians are Guyanese (8.2%, a difference of 0.0%), Nigerian (8.2%, a difference of 0.17%), Immigrants from Sierra Leone (8.2%, a difference of 0.18%), Immigrants from Guyana (8.2%, a difference of 0.18%), and Immigrants from Western Africa (8.2%, a difference of 0.27%).
| Demographics | Rating | Rank | Unemployment Among Women with Children Under 6 years |
| Native Hawaiians | 1.7 /100 | #245 | Tragic 8.2% |
| Central Americans | 1.4 /100 | #246 | Tragic 8.2% |
| German Russians | 1.2 /100 | #247 | Tragic 8.2% |
| Immigrants | Western Africa | 1.1 /100 | #248 | Tragic 8.2% |
| Immigrants | Sierra Leone | 1.1 /100 | #249 | Tragic 8.2% |
| Nigerians | 1.1 /100 | #250 | Tragic 8.2% |
| Guyanese | 1.0 /100 | #251 | Tragic 8.2% |
| Ghanaians | 1.0 /100 | #252 | Tragic 8.2% |
| Immigrants | Guyana | 0.8 /100 | #253 | Tragic 8.2% |
| Immigrants | Caribbean | 0.7 /100 | #254 | Tragic 8.3% |
| Immigrants | Portugal | 0.6 /100 | #255 | Tragic 8.3% |
| Celtics | 0.6 /100 | #256 | Tragic 8.3% |
| British West Indians | 0.5 /100 | #257 | Tragic 8.3% |
| Immigrants | Ghana | 0.5 /100 | #258 | Tragic 8.3% |
| Barbadians | 0.4 /100 | #259 | Tragic 8.3% |