Northern European vs Ghanaian Unemployment Among Women with Children Under 6 years
COMPARE
Northern European
Ghanaian
Unemployment Among Women with Children Under 6 years
Unemployment Among Women with Children Under 6 years Comparison
Northern Europeans
Ghanaians
7.5%
UNEMPLOYMENT AMONG WOMEN WITH CHILDREN UNDER 6 YEARS
74.3/ 100
METRIC RATING
154th/ 347
METRIC RANK
8.2%
UNEMPLOYMENT AMONG WOMEN WITH CHILDREN UNDER 6 YEARS
1.0/ 100
METRIC RATING
252nd/ 347
METRIC RANK
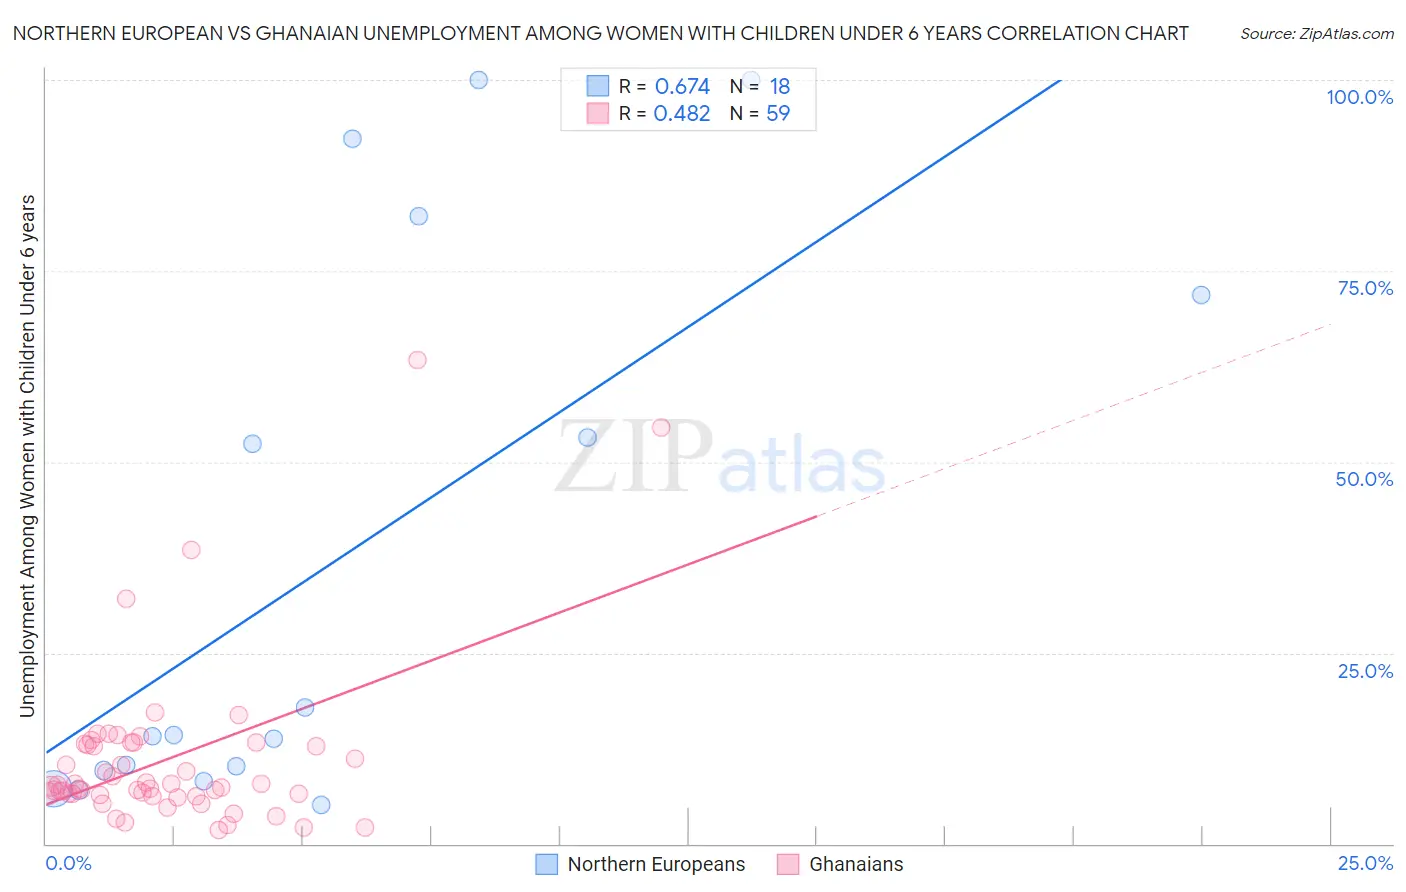
Northern European vs Ghanaian Unemployment Among Women with Children Under 6 years Correlation Chart
The statistical analysis conducted on geographies consisting of 297,166,845 people shows a significant positive correlation between the proportion of Northern Europeans and unemployment rate among women with children under the age of 6 in the United States with a correlation coefficient (R) of 0.674 and weighted average of 7.5%. Similarly, the statistical analysis conducted on geographies consisting of 165,389,442 people shows a moderate positive correlation between the proportion of Ghanaians and unemployment rate among women with children under the age of 6 in the United States with a correlation coefficient (R) of 0.482 and weighted average of 8.2%, a difference of 9.6%.
Unemployment Among Women with Children Under 6 years Correlation Summary
| Measurement | Northern European | Ghanaian |
| Minimum | 5.1% | 1.8% |
| Maximum | 100.0% | 63.4% |
| Range | 94.9% | 61.6% |
| Mean | 37.2% | 11.0% |
| Median | 14.2% | 7.6% |
| Interquartile 25% (IQ1) | 9.6% | 6.5% |
| Interquartile 75% (IQ3) | 71.9% | 13.2% |
| Interquartile Range (IQR) | 62.3% | 6.7% |
| Standard Deviation (Sample) | 36.4% | 11.0% |
| Standard Deviation (Population) | 35.4% | 10.9% |
Similar Demographics by Unemployment Among Women with Children Under 6 years
Demographics Similar to Northern Europeans by Unemployment Among Women with Children Under 6 years
In terms of unemployment among women with children under 6 years, the demographic groups most similar to Northern Europeans are South American (7.5%, a difference of 0.020%), Uruguayan (7.5%, a difference of 0.030%), Bangladeshi (7.5%, a difference of 0.040%), Immigrants from Peru (7.5%, a difference of 0.050%), and Immigrants from Southern Europe (7.5%, a difference of 0.10%).
| Demographics | Rating | Rank | Unemployment Among Women with Children Under 6 years |
| Immigrants | Oceania | 78.4 /100 | #147 | Good 7.5% |
| Immigrants | Brazil | 77.3 /100 | #148 | Good 7.5% |
| Colombians | 76.1 /100 | #149 | Good 7.5% |
| Aleuts | 76.0 /100 | #150 | Good 7.5% |
| Immigrants | Peru | 74.9 /100 | #151 | Good 7.5% |
| Bangladeshis | 74.8 /100 | #152 | Good 7.5% |
| Uruguayans | 74.7 /100 | #153 | Good 7.5% |
| Northern Europeans | 74.3 /100 | #154 | Good 7.5% |
| South Americans | 74.1 /100 | #155 | Good 7.5% |
| Immigrants | Southern Europe | 73.2 /100 | #156 | Good 7.5% |
| Peruvians | 72.3 /100 | #157 | Good 7.5% |
| Croatians | 71.9 /100 | #158 | Good 7.5% |
| Immigrants | Philippines | 71.3 /100 | #159 | Good 7.5% |
| Bolivians | 70.8 /100 | #160 | Good 7.5% |
| Immigrants | Western Asia | 70.2 /100 | #161 | Good 7.5% |
Demographics Similar to Ghanaians by Unemployment Among Women with Children Under 6 years
In terms of unemployment among women with children under 6 years, the demographic groups most similar to Ghanaians are Guyanese (8.2%, a difference of 0.0%), Nigerian (8.2%, a difference of 0.17%), Immigrants from Sierra Leone (8.2%, a difference of 0.18%), Immigrants from Guyana (8.2%, a difference of 0.18%), and Immigrants from Western Africa (8.2%, a difference of 0.27%).
| Demographics | Rating | Rank | Unemployment Among Women with Children Under 6 years |
| Native Hawaiians | 1.7 /100 | #245 | Tragic 8.2% |
| Central Americans | 1.4 /100 | #246 | Tragic 8.2% |
| German Russians | 1.2 /100 | #247 | Tragic 8.2% |
| Immigrants | Western Africa | 1.1 /100 | #248 | Tragic 8.2% |
| Immigrants | Sierra Leone | 1.1 /100 | #249 | Tragic 8.2% |
| Nigerians | 1.1 /100 | #250 | Tragic 8.2% |
| Guyanese | 1.0 /100 | #251 | Tragic 8.2% |
| Ghanaians | 1.0 /100 | #252 | Tragic 8.2% |
| Immigrants | Guyana | 0.8 /100 | #253 | Tragic 8.2% |
| Immigrants | Caribbean | 0.7 /100 | #254 | Tragic 8.3% |
| Immigrants | Portugal | 0.6 /100 | #255 | Tragic 8.3% |
| Celtics | 0.6 /100 | #256 | Tragic 8.3% |
| British West Indians | 0.5 /100 | #257 | Tragic 8.3% |
| Immigrants | Ghana | 0.5 /100 | #258 | Tragic 8.3% |
| Barbadians | 0.4 /100 | #259 | Tragic 8.3% |