Cherokee vs Hmong Unemployment Among Women with Children Under 6 years
COMPARE
Cherokee
Hmong
Unemployment Among Women with Children Under 6 years
Unemployment Among Women with Children Under 6 years Comparison
Cherokee
Hmong
9.3%
UNEMPLOYMENT AMONG WOMEN WITH CHILDREN UNDER 6 YEARS
0.0/ 100
METRIC RATING
315th/ 347
METRIC RANK
6.7%
UNEMPLOYMENT AMONG WOMEN WITH CHILDREN UNDER 6 YEARS
100.0/ 100
METRIC RATING
38th/ 347
METRIC RANK
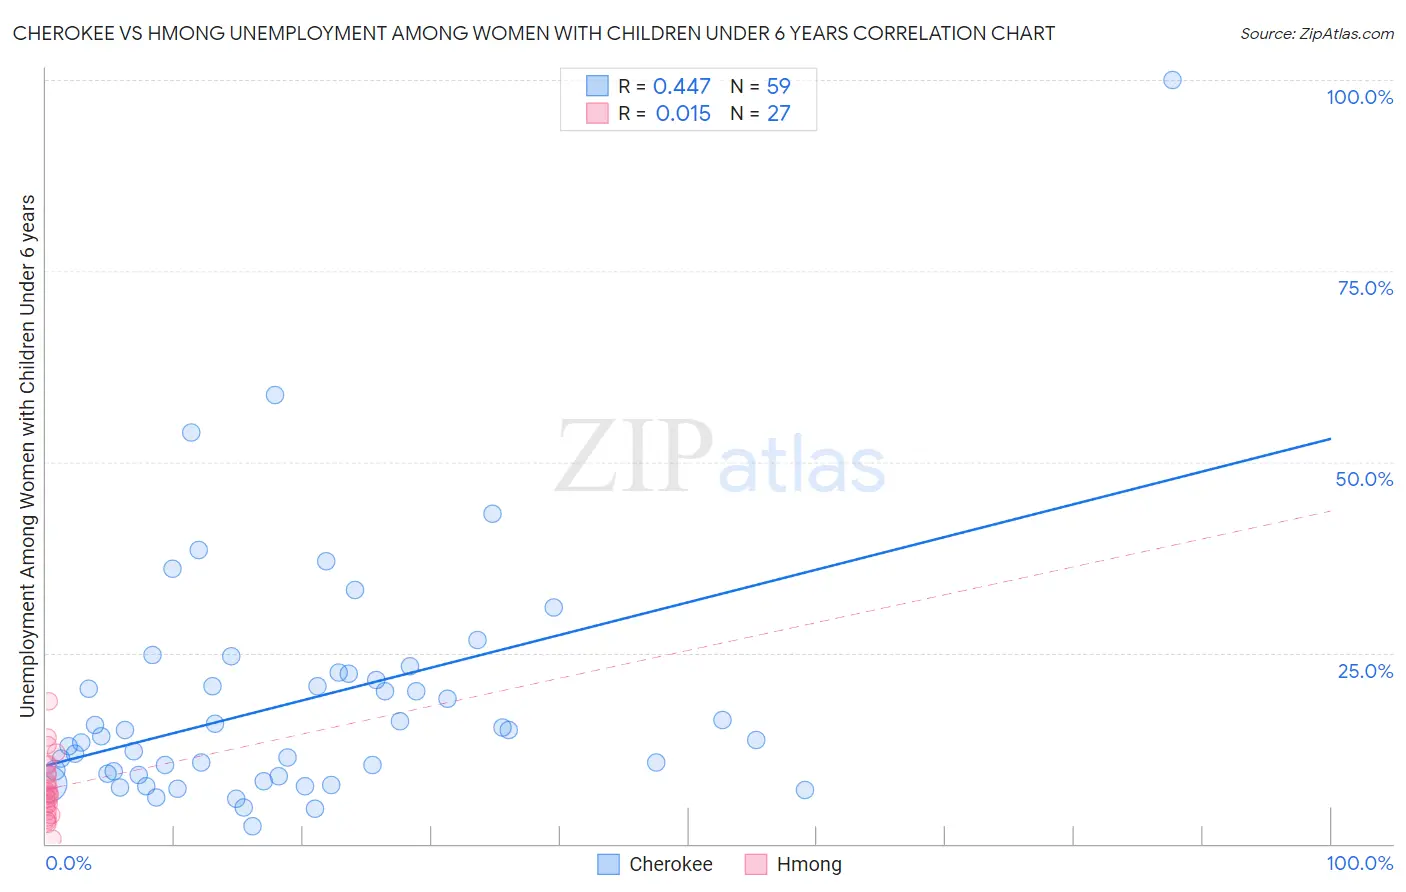
Cherokee vs Hmong Unemployment Among Women with Children Under 6 years Correlation Chart
The statistical analysis conducted on geographies consisting of 349,052,649 people shows a moderate positive correlation between the proportion of Cherokee and unemployment rate among women with children under the age of 6 in the United States with a correlation coefficient (R) of 0.447 and weighted average of 9.3%. Similarly, the statistical analysis conducted on geographies consisting of 24,062,767 people shows no correlation between the proportion of Hmong and unemployment rate among women with children under the age of 6 in the United States with a correlation coefficient (R) of 0.015 and weighted average of 6.7%, a difference of 40.2%.
Unemployment Among Women with Children Under 6 years Correlation Summary
| Measurement | Cherokee | Hmong |
| Minimum | 2.3% | 0.60% |
| Maximum | 100.0% | 18.7% |
| Range | 97.7% | 18.1% |
| Mean | 18.6% | 7.2% |
| Median | 14.1% | 6.4% |
| Interquartile 25% (IQ1) | 9.0% | 4.3% |
| Interquartile 75% (IQ3) | 22.2% | 9.2% |
| Interquartile Range (IQR) | 13.2% | 4.9% |
| Standard Deviation (Sample) | 15.9% | 4.0% |
| Standard Deviation (Population) | 15.8% | 3.9% |
Similar Demographics by Unemployment Among Women with Children Under 6 years
Demographics Similar to Cherokee by Unemployment Among Women with Children Under 6 years
In terms of unemployment among women with children under 6 years, the demographic groups most similar to Cherokee are Fijian (9.3%, a difference of 0.78%), Houma (9.4%, a difference of 0.78%), American (9.3%, a difference of 0.80%), Immigrants from the Azores (9.2%, a difference of 1.2%), and French American Indian (9.2%, a difference of 1.4%).
| Demographics | Rating | Rank | Unemployment Among Women with Children Under 6 years |
| Immigrants | Micronesia | 0.0 /100 | #308 | Tragic 9.1% |
| Africans | 0.0 /100 | #309 | Tragic 9.2% |
| Cajuns | 0.0 /100 | #310 | Tragic 9.2% |
| French American Indians | 0.0 /100 | #311 | Tragic 9.2% |
| Immigrants | Azores | 0.0 /100 | #312 | Tragic 9.2% |
| Americans | 0.0 /100 | #313 | Tragic 9.3% |
| Fijians | 0.0 /100 | #314 | Tragic 9.3% |
| Cherokee | 0.0 /100 | #315 | Tragic 9.3% |
| Houma | 0.0 /100 | #316 | Tragic 9.4% |
| Dutch West Indians | 0.0 /100 | #317 | Tragic 9.5% |
| Osage | 0.0 /100 | #318 | Tragic 9.5% |
| Marshallese | 0.0 /100 | #319 | Tragic 9.6% |
| Potawatomi | 0.0 /100 | #320 | Tragic 9.6% |
| Central American Indians | 0.0 /100 | #321 | Tragic 9.6% |
| Alaska Natives | 0.0 /100 | #322 | Tragic 9.6% |
Demographics Similar to Hmong by Unemployment Among Women with Children Under 6 years
In terms of unemployment among women with children under 6 years, the demographic groups most similar to Hmong are Immigrants from Russia (6.7%, a difference of 0.060%), Sri Lankan (6.6%, a difference of 0.13%), Asian (6.7%, a difference of 0.28%), Luxembourger (6.6%, a difference of 0.38%), and Immigrants from Indonesia (6.7%, a difference of 0.44%).
| Demographics | Rating | Rank | Unemployment Among Women with Children Under 6 years |
| Immigrants | Moldova | 100.0 /100 | #31 | Exceptional 6.6% |
| Tsimshian | 100.0 /100 | #32 | Exceptional 6.6% |
| Immigrants | Vietnam | 100.0 /100 | #33 | Exceptional 6.6% |
| Immigrants | South Central Asia | 100.0 /100 | #34 | Exceptional 6.6% |
| Yakama | 100.0 /100 | #35 | Exceptional 6.6% |
| Luxembourgers | 100.0 /100 | #36 | Exceptional 6.6% |
| Sri Lankans | 100.0 /100 | #37 | Exceptional 6.6% |
| Hmong | 100.0 /100 | #38 | Exceptional 6.7% |
| Immigrants | Russia | 100.0 /100 | #39 | Exceptional 6.7% |
| Asians | 100.0 /100 | #40 | Exceptional 6.7% |
| Immigrants | Indonesia | 99.9 /100 | #41 | Exceptional 6.7% |
| Immigrants | Cuba | 99.9 /100 | #42 | Exceptional 6.7% |
| Bhutanese | 99.9 /100 | #43 | Exceptional 6.7% |
| Iranians | 99.9 /100 | #44 | Exceptional 6.7% |
| Immigrants | Australia | 99.9 /100 | #45 | Exceptional 6.8% |