South American Indian vs Basque Unemployment Among Women with Children Under 18 years
COMPARE
South American Indian
Basque
Unemployment Among Women with Children Under 18 years
Unemployment Among Women with Children Under 18 years Comparison
South American Indians
Basques
5.5%
UNEMPLOYMENT AMONG WOMEN WITH CHILDREN UNDER 18 YEARS
30.8/ 100
METRIC RATING
191st/ 347
METRIC RANK
5.3%
UNEMPLOYMENT AMONG WOMEN WITH CHILDREN UNDER 18 YEARS
86.5/ 100
METRIC RATING
119th/ 347
METRIC RANK
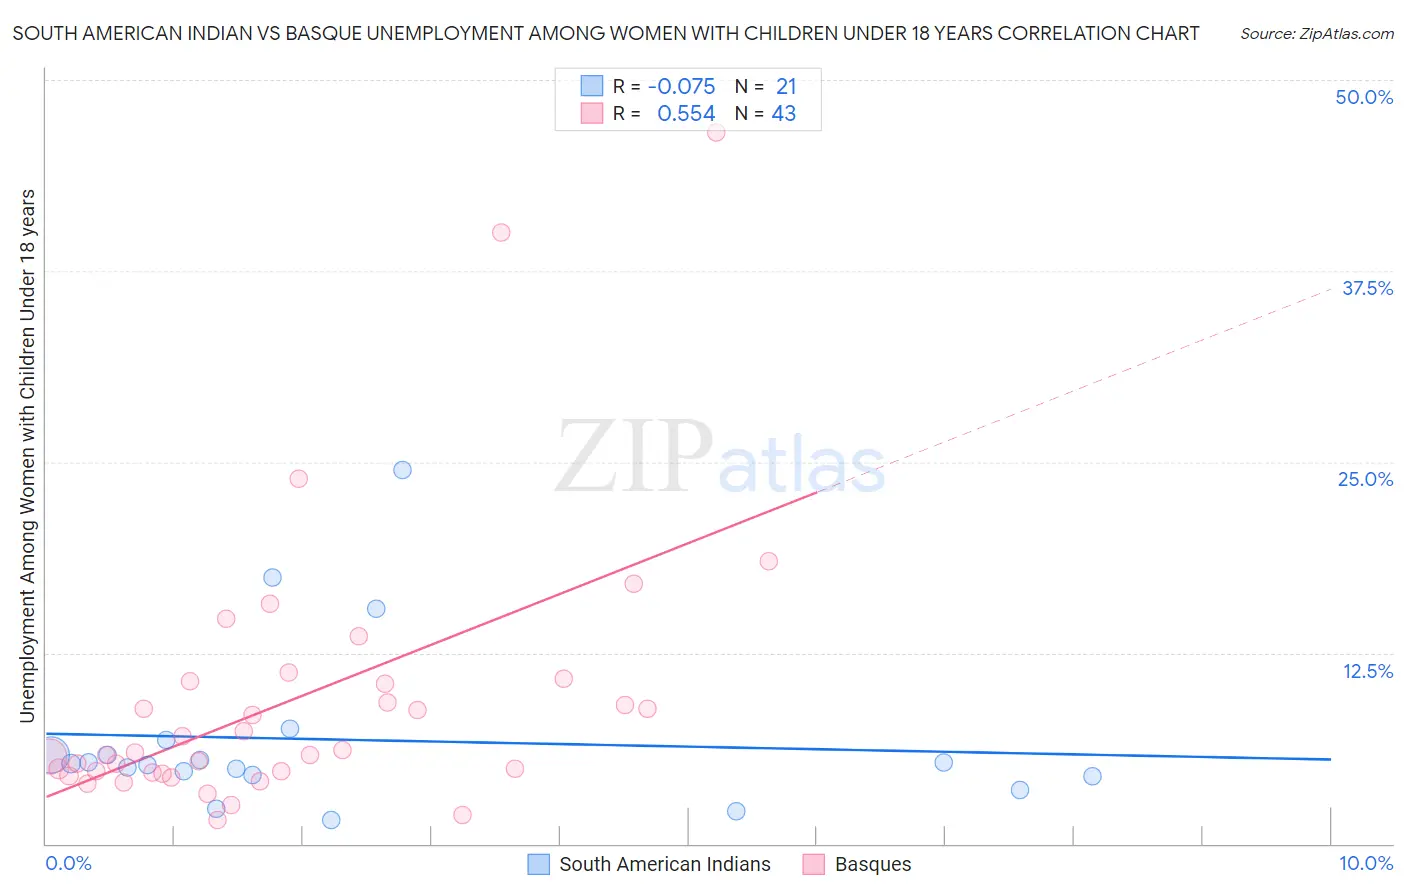
South American Indian vs Basque Unemployment Among Women with Children Under 18 years Correlation Chart
The statistical analysis conducted on geographies consisting of 162,320,289 people shows a slight negative correlation between the proportion of South American Indians and unemployment rate among women with children under the age of 18 in the United States with a correlation coefficient (R) of -0.075 and weighted average of 5.5%. Similarly, the statistical analysis conducted on geographies consisting of 162,382,106 people shows a substantial positive correlation between the proportion of Basques and unemployment rate among women with children under the age of 18 in the United States with a correlation coefficient (R) of 0.554 and weighted average of 5.3%, a difference of 4.9%.
Unemployment Among Women with Children Under 18 years Correlation Summary
| Measurement | South American Indian | Basque |
| Minimum | 1.6% | 1.5% |
| Maximum | 24.5% | 46.6% |
| Range | 22.9% | 45.1% |
| Mean | 6.8% | 9.4% |
| Median | 5.2% | 6.0% |
| Interquartile 25% (IQ1) | 4.5% | 4.7% |
| Interquartile 75% (IQ3) | 6.3% | 10.7% |
| Interquartile Range (IQR) | 1.8% | 6.0% |
| Standard Deviation (Sample) | 5.5% | 8.9% |
| Standard Deviation (Population) | 5.4% | 8.8% |
Similar Demographics by Unemployment Among Women with Children Under 18 years
Demographics Similar to South American Indians by Unemployment Among Women with Children Under 18 years
In terms of unemployment among women with children under 18 years, the demographic groups most similar to South American Indians are Immigrants from Spain (5.5%, a difference of 0.010%), Immigrants from Poland (5.5%, a difference of 0.030%), Immigrants from Afghanistan (5.5%, a difference of 0.13%), Immigrants from Chile (5.5%, a difference of 0.14%), and Immigrants from Eritrea (5.5%, a difference of 0.24%).
| Demographics | Rating | Rank | Unemployment Among Women with Children Under 18 years |
| Immigrants | Cambodia | 38.4 /100 | #184 | Fair 5.5% |
| Immigrants | Zaire | 38.1 /100 | #185 | Fair 5.5% |
| Indonesians | 36.3 /100 | #186 | Fair 5.5% |
| Malaysians | 35.7 /100 | #187 | Fair 5.5% |
| Iraqis | 35.3 /100 | #188 | Fair 5.5% |
| Immigrants | Eritrea | 33.8 /100 | #189 | Fair 5.5% |
| Immigrants | Poland | 31.2 /100 | #190 | Fair 5.5% |
| South American Indians | 30.8 /100 | #191 | Fair 5.5% |
| Immigrants | Spain | 30.7 /100 | #192 | Fair 5.5% |
| Immigrants | Afghanistan | 29.3 /100 | #193 | Fair 5.5% |
| Immigrants | Chile | 29.2 /100 | #194 | Fair 5.5% |
| Colombians | 22.8 /100 | #195 | Fair 5.6% |
| Spaniards | 22.8 /100 | #196 | Fair 5.6% |
| Immigrants | Colombia | 21.4 /100 | #197 | Fair 5.6% |
| Arabs | 21.4 /100 | #198 | Fair 5.6% |
Demographics Similar to Basques by Unemployment Among Women with Children Under 18 years
In terms of unemployment among women with children under 18 years, the demographic groups most similar to Basques are Egyptian (5.3%, a difference of 0.020%), Immigrants from Europe (5.3%, a difference of 0.030%), Immigrants from Romania (5.3%, a difference of 0.11%), Canadian (5.3%, a difference of 0.13%), and Scotch-Irish (5.3%, a difference of 0.13%).
| Demographics | Rating | Rank | Unemployment Among Women with Children Under 18 years |
| Immigrants | Eastern Europe | 88.5 /100 | #112 | Excellent 5.2% |
| French | 88.4 /100 | #113 | Excellent 5.2% |
| Kenyans | 88.2 /100 | #114 | Excellent 5.3% |
| Hungarians | 88.1 /100 | #115 | Excellent 5.3% |
| Macedonians | 87.7 /100 | #116 | Excellent 5.3% |
| Canadians | 87.4 /100 | #117 | Excellent 5.3% |
| Immigrants | Europe | 86.7 /100 | #118 | Excellent 5.3% |
| Basques | 86.5 /100 | #119 | Excellent 5.3% |
| Egyptians | 86.4 /100 | #120 | Excellent 5.3% |
| Immigrants | Romania | 85.8 /100 | #121 | Excellent 5.3% |
| Scotch-Irish | 85.7 /100 | #122 | Excellent 5.3% |
| Sudanese | 84.3 /100 | #123 | Excellent 5.3% |
| Native Hawaiians | 84.0 /100 | #124 | Excellent 5.3% |
| Immigrants | North Macedonia | 83.2 /100 | #125 | Excellent 5.3% |
| Immigrants | Oceania | 83.1 /100 | #126 | Excellent 5.3% |