Sri Lankan vs Basque Unemployment Among Women with Children Under 18 years
COMPARE
Sri Lankan
Basque
Unemployment Among Women with Children Under 18 years
Unemployment Among Women with Children Under 18 years Comparison
Sri Lankans
Basques
5.2%
UNEMPLOYMENT AMONG WOMEN WITH CHILDREN UNDER 18 YEARS
90.3/ 100
METRIC RATING
103rd/ 347
METRIC RANK
5.3%
UNEMPLOYMENT AMONG WOMEN WITH CHILDREN UNDER 18 YEARS
86.5/ 100
METRIC RATING
119th/ 347
METRIC RANK
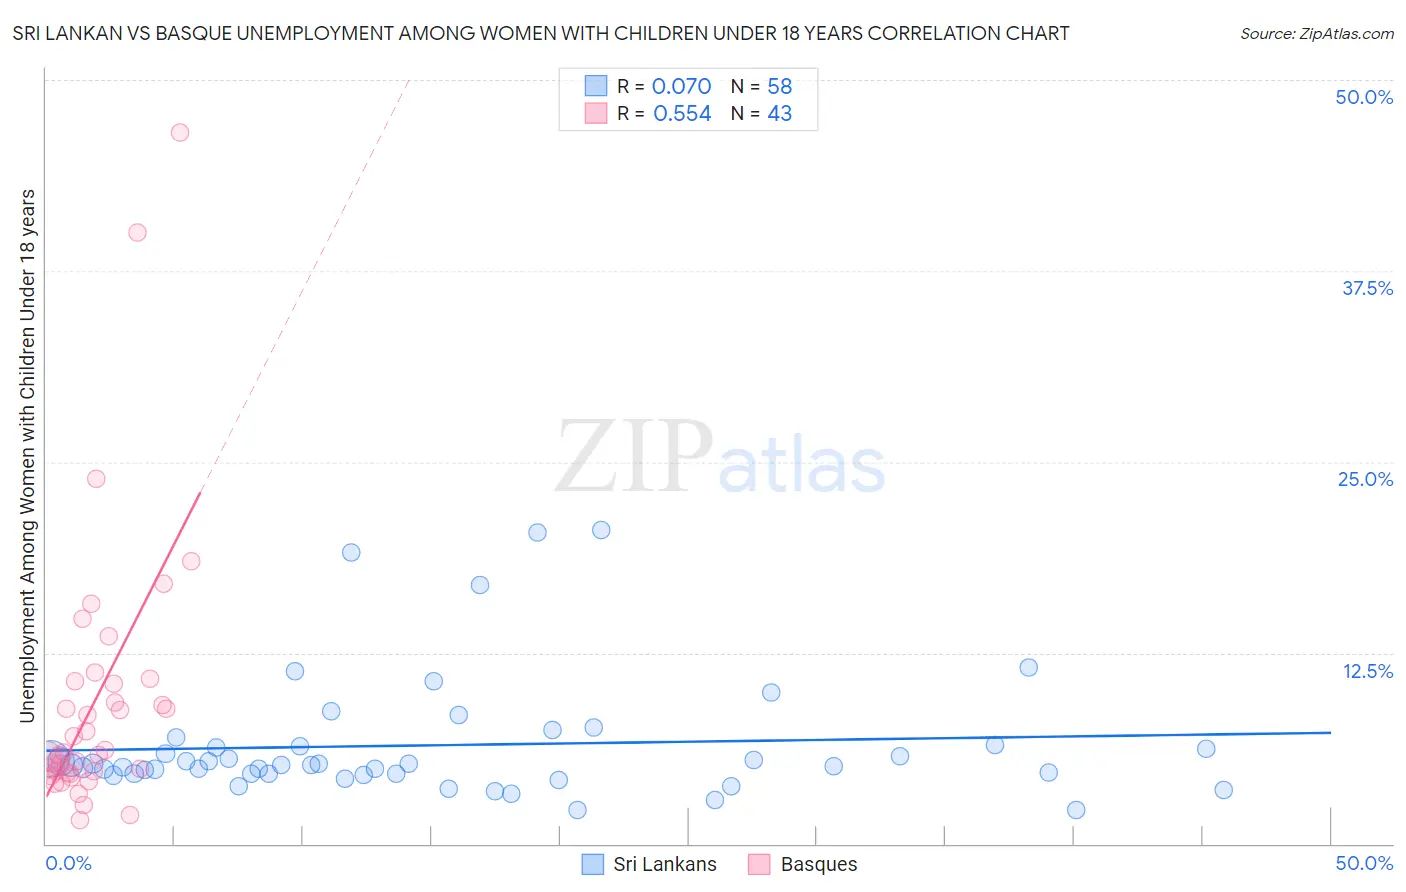
Sri Lankan vs Basque Unemployment Among Women with Children Under 18 years Correlation Chart
The statistical analysis conducted on geographies consisting of 422,094,249 people shows a slight positive correlation between the proportion of Sri Lankans and unemployment rate among women with children under the age of 18 in the United States with a correlation coefficient (R) of 0.070 and weighted average of 5.2%. Similarly, the statistical analysis conducted on geographies consisting of 162,382,106 people shows a substantial positive correlation between the proportion of Basques and unemployment rate among women with children under the age of 18 in the United States with a correlation coefficient (R) of 0.554 and weighted average of 5.3%, a difference of 0.68%.
Unemployment Among Women with Children Under 18 years Correlation Summary
| Measurement | Sri Lankan | Basque |
| Minimum | 2.2% | 1.5% |
| Maximum | 20.5% | 46.6% |
| Range | 18.3% | 45.1% |
| Mean | 6.4% | 9.4% |
| Median | 5.2% | 6.0% |
| Interquartile 25% (IQ1) | 4.6% | 4.7% |
| Interquartile 75% (IQ3) | 6.4% | 10.7% |
| Interquartile Range (IQR) | 1.8% | 6.0% |
| Standard Deviation (Sample) | 4.0% | 8.9% |
| Standard Deviation (Population) | 4.0% | 8.8% |
Demographics Similar to Sri Lankans and Basques by Unemployment Among Women with Children Under 18 years
In terms of unemployment among women with children under 18 years, the demographic groups most similar to Sri Lankans are Immigrants from Switzerland (5.2%, a difference of 0.040%), Immigrants from France (5.2%, a difference of 0.060%), Pakistani (5.2%, a difference of 0.080%), Slavic (5.2%, a difference of 0.090%), and Iranian (5.2%, a difference of 0.13%). Similarly, the demographic groups most similar to Basques are Egyptian (5.3%, a difference of 0.020%), Immigrants from Europe (5.3%, a difference of 0.030%), Immigrants from Romania (5.3%, a difference of 0.11%), Canadian (5.3%, a difference of 0.13%), and Macedonian (5.3%, a difference of 0.19%).
| Demographics | Rating | Rank | Unemployment Among Women with Children Under 18 years |
| Immigrants | Netherlands | 91.0 /100 | #101 | Exceptional 5.2% |
| Immigrants | Cuba | 90.9 /100 | #102 | Exceptional 5.2% |
| Sri Lankans | 90.3 /100 | #103 | Exceptional 5.2% |
| Immigrants | Switzerland | 90.1 /100 | #104 | Exceptional 5.2% |
| Immigrants | France | 90.0 /100 | #105 | Excellent 5.2% |
| Pakistanis | 89.9 /100 | #106 | Excellent 5.2% |
| Slavs | 89.8 /100 | #107 | Excellent 5.2% |
| Iranians | 89.7 /100 | #108 | Excellent 5.2% |
| Immigrants | Russia | 89.0 /100 | #109 | Excellent 5.2% |
| Immigrants | Czechoslovakia | 88.9 /100 | #110 | Excellent 5.2% |
| French Canadians | 88.9 /100 | #111 | Excellent 5.2% |
| Immigrants | Eastern Europe | 88.5 /100 | #112 | Excellent 5.2% |
| French | 88.4 /100 | #113 | Excellent 5.2% |
| Kenyans | 88.2 /100 | #114 | Excellent 5.3% |
| Hungarians | 88.1 /100 | #115 | Excellent 5.3% |
| Macedonians | 87.7 /100 | #116 | Excellent 5.3% |
| Canadians | 87.4 /100 | #117 | Excellent 5.3% |
| Immigrants | Europe | 86.7 /100 | #118 | Excellent 5.3% |
| Basques | 86.5 /100 | #119 | Excellent 5.3% |
| Egyptians | 86.4 /100 | #120 | Excellent 5.3% |
| Immigrants | Romania | 85.8 /100 | #121 | Excellent 5.3% |