Central American vs West Indian Female Unemployment
COMPARE
Central American
West Indian
Female Unemployment
Female Unemployment Comparison
Central Americans
West Indians
5.9%
FEMALE UNEMPLOYMENT
0.0/ 100
METRIC RATING
271st/ 347
METRIC RANK
6.1%
FEMALE UNEMPLOYMENT
0.0/ 100
METRIC RATING
297th/ 347
METRIC RANK
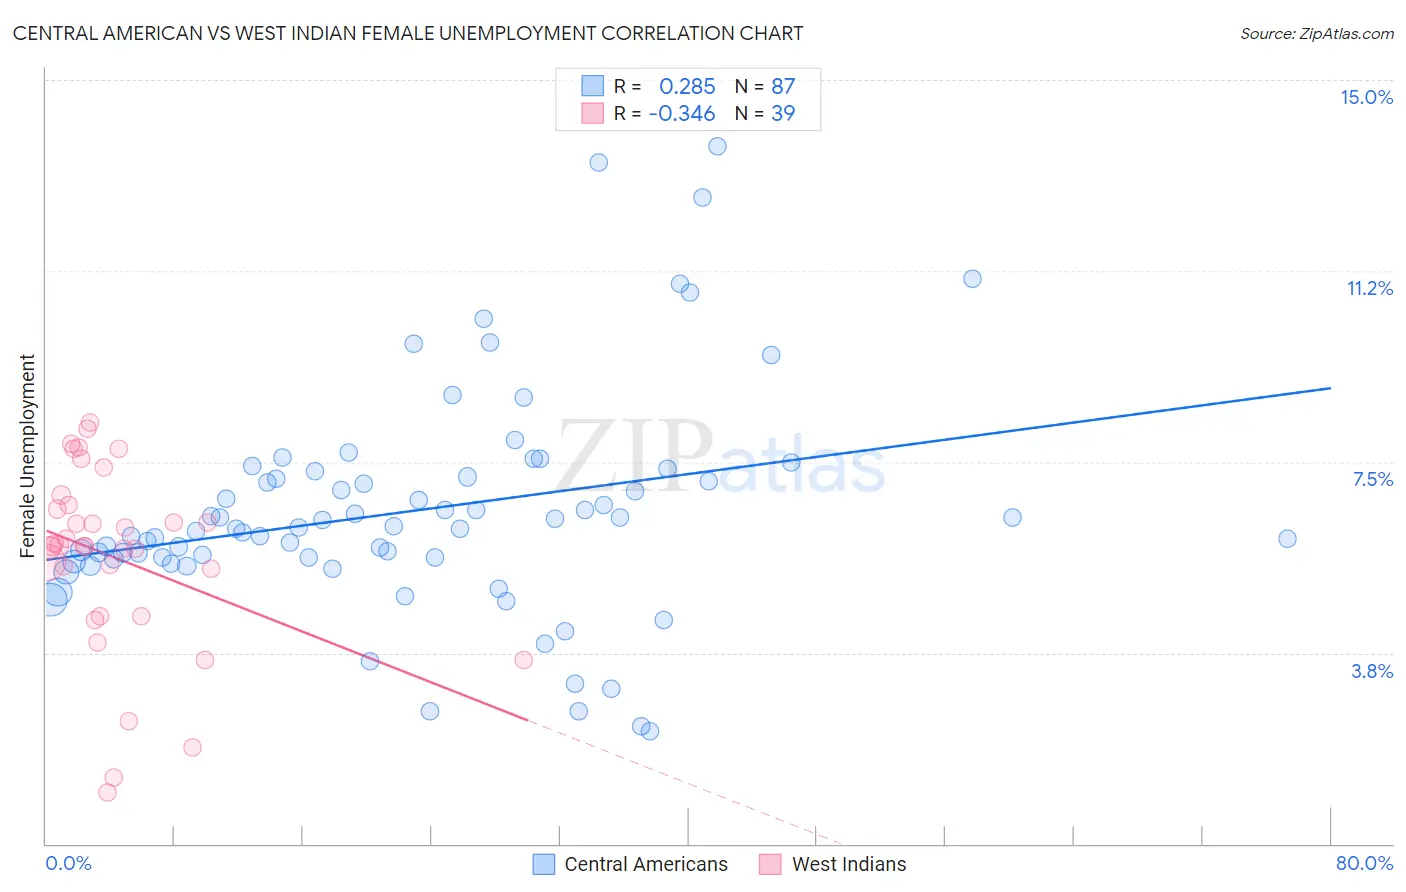
Central American vs West Indian Female Unemployment Correlation Chart
The statistical analysis conducted on geographies consisting of 499,975,290 people shows a weak positive correlation between the proportion of Central Americans and unemploymnet rate among females in the United States with a correlation coefficient (R) of 0.285 and weighted average of 5.9%. Similarly, the statistical analysis conducted on geographies consisting of 253,607,291 people shows a mild negative correlation between the proportion of West Indians and unemploymnet rate among females in the United States with a correlation coefficient (R) of -0.346 and weighted average of 6.1%, a difference of 3.2%.
Female Unemployment Correlation Summary
| Measurement | Central American | West Indian |
| Minimum | 2.2% | 1.0% |
| Maximum | 13.7% | 8.3% |
| Range | 11.5% | 7.3% |
| Mean | 6.5% | 5.6% |
| Median | 6.2% | 5.9% |
| Interquartile 25% (IQ1) | 5.6% | 4.5% |
| Interquartile 75% (IQ3) | 7.2% | 6.7% |
| Interquartile Range (IQR) | 1.6% | 2.2% |
| Standard Deviation (Sample) | 2.2% | 1.8% |
| Standard Deviation (Population) | 2.2% | 1.8% |
Similar Demographics by Female Unemployment
Demographics Similar to Central Americans by Female Unemployment
In terms of female unemployment, the demographic groups most similar to Central Americans are Immigrants from Honduras (5.9%, a difference of 0.10%), Lumbee (5.9%, a difference of 0.19%), Ghanaian (5.9%, a difference of 0.20%), African (5.9%, a difference of 0.28%), and Immigrants from Western Africa (5.9%, a difference of 0.51%).
| Demographics | Rating | Rank | Female Unemployment |
| Immigrants | Bahamas | 0.1 /100 | #264 | Tragic 5.8% |
| Blackfeet | 0.0 /100 | #265 | Tragic 5.9% |
| Cape Verdeans | 0.0 /100 | #266 | Tragic 5.9% |
| Nepalese | 0.0 /100 | #267 | Tragic 5.9% |
| Hondurans | 0.0 /100 | #268 | Tragic 5.9% |
| Immigrants | Western Africa | 0.0 /100 | #269 | Tragic 5.9% |
| Immigrants | Honduras | 0.0 /100 | #270 | Tragic 5.9% |
| Central Americans | 0.0 /100 | #271 | Tragic 5.9% |
| Lumbee | 0.0 /100 | #272 | Tragic 5.9% |
| Ghanaians | 0.0 /100 | #273 | Tragic 5.9% |
| Africans | 0.0 /100 | #274 | Tragic 5.9% |
| Senegalese | 0.0 /100 | #275 | Tragic 6.0% |
| Bahamians | 0.0 /100 | #276 | Tragic 6.0% |
| Immigrants | Ghana | 0.0 /100 | #277 | Tragic 6.0% |
| Yaqui | 0.0 /100 | #278 | Tragic 6.0% |
Demographics Similar to West Indians by Female Unemployment
In terms of female unemployment, the demographic groups most similar to West Indians are Alaskan Athabascan (6.1%, a difference of 0.010%), Jamaican (6.1%, a difference of 0.020%), Immigrants from Latin America (6.1%, a difference of 0.030%), Immigrants from El Salvador (6.1%, a difference of 0.13%), and Ute (6.1%, a difference of 0.13%).
| Demographics | Rating | Rank | Female Unemployment |
| Immigrants | Caribbean | 0.0 /100 | #290 | Tragic 6.1% |
| Immigrants | West Indies | 0.0 /100 | #291 | Tragic 6.1% |
| Immigrants | Trinidad and Tobago | 0.0 /100 | #292 | Tragic 6.1% |
| Mexicans | 0.0 /100 | #293 | Tragic 6.1% |
| Immigrants | El Salvador | 0.0 /100 | #294 | Tragic 6.1% |
| Immigrants | Latin America | 0.0 /100 | #295 | Tragic 6.1% |
| Alaskan Athabascans | 0.0 /100 | #296 | Tragic 6.1% |
| West Indians | 0.0 /100 | #297 | Tragic 6.1% |
| Jamaicans | 0.0 /100 | #298 | Tragic 6.1% |
| Ute | 0.0 /100 | #299 | Tragic 6.1% |
| Immigrants | Haiti | 0.0 /100 | #300 | Tragic 6.1% |
| Immigrants | Barbados | 0.0 /100 | #301 | Tragic 6.2% |
| U.S. Virgin Islanders | 0.0 /100 | #302 | Tragic 6.2% |
| Barbadians | 0.0 /100 | #303 | Tragic 6.2% |
| Immigrants | Jamaica | 0.0 /100 | #304 | Tragic 6.2% |