Central American vs Slovak Female Unemployment
COMPARE
Central American
Slovak
Female Unemployment
Female Unemployment Comparison
Central Americans
Slovaks
5.9%
FEMALE UNEMPLOYMENT
0.0/ 100
METRIC RATING
271st/ 347
METRIC RANK
4.8%
FEMALE UNEMPLOYMENT
99.8/ 100
METRIC RATING
32nd/ 347
METRIC RANK
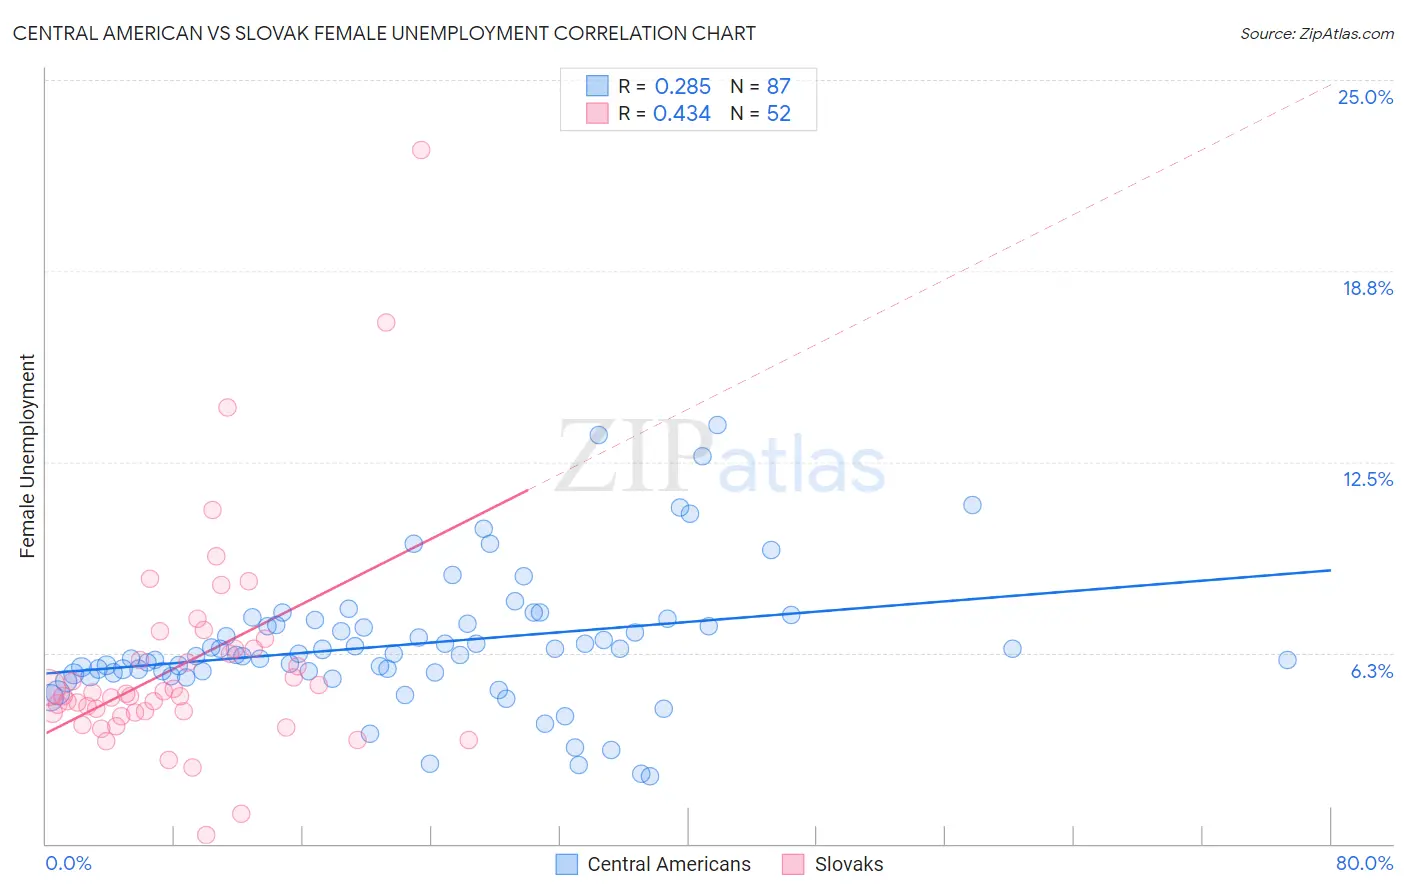
Central American vs Slovak Female Unemployment Correlation Chart
The statistical analysis conducted on geographies consisting of 499,975,290 people shows a weak positive correlation between the proportion of Central Americans and unemploymnet rate among females in the United States with a correlation coefficient (R) of 0.285 and weighted average of 5.9%. Similarly, the statistical analysis conducted on geographies consisting of 394,798,078 people shows a moderate positive correlation between the proportion of Slovaks and unemploymnet rate among females in the United States with a correlation coefficient (R) of 0.434 and weighted average of 4.8%, a difference of 24.5%.
Female Unemployment Correlation Summary
| Measurement | Central American | Slovak |
| Minimum | 2.2% | 0.30% |
| Maximum | 13.7% | 22.7% |
| Range | 11.5% | 22.4% |
| Mean | 6.5% | 5.9% |
| Median | 6.2% | 4.9% |
| Interquartile 25% (IQ1) | 5.6% | 4.3% |
| Interquartile 75% (IQ3) | 7.2% | 6.4% |
| Interquartile Range (IQR) | 1.6% | 2.1% |
| Standard Deviation (Sample) | 2.2% | 3.7% |
| Standard Deviation (Population) | 2.2% | 3.6% |
Similar Demographics by Female Unemployment
Demographics Similar to Central Americans by Female Unemployment
In terms of female unemployment, the demographic groups most similar to Central Americans are Immigrants from Honduras (5.9%, a difference of 0.10%), Lumbee (5.9%, a difference of 0.19%), Ghanaian (5.9%, a difference of 0.20%), African (5.9%, a difference of 0.28%), and Immigrants from Western Africa (5.9%, a difference of 0.51%).
| Demographics | Rating | Rank | Female Unemployment |
| Immigrants | Bahamas | 0.1 /100 | #264 | Tragic 5.8% |
| Blackfeet | 0.0 /100 | #265 | Tragic 5.9% |
| Cape Verdeans | 0.0 /100 | #266 | Tragic 5.9% |
| Nepalese | 0.0 /100 | #267 | Tragic 5.9% |
| Hondurans | 0.0 /100 | #268 | Tragic 5.9% |
| Immigrants | Western Africa | 0.0 /100 | #269 | Tragic 5.9% |
| Immigrants | Honduras | 0.0 /100 | #270 | Tragic 5.9% |
| Central Americans | 0.0 /100 | #271 | Tragic 5.9% |
| Lumbee | 0.0 /100 | #272 | Tragic 5.9% |
| Ghanaians | 0.0 /100 | #273 | Tragic 5.9% |
| Africans | 0.0 /100 | #274 | Tragic 5.9% |
| Senegalese | 0.0 /100 | #275 | Tragic 6.0% |
| Bahamians | 0.0 /100 | #276 | Tragic 6.0% |
| Immigrants | Ghana | 0.0 /100 | #277 | Tragic 6.0% |
| Yaqui | 0.0 /100 | #278 | Tragic 6.0% |
Demographics Similar to Slovaks by Female Unemployment
In terms of female unemployment, the demographic groups most similar to Slovaks are Sudanese (4.8%, a difference of 0.14%), Lithuanian (4.7%, a difference of 0.42%), Czechoslovakian (4.8%, a difference of 0.51%), Cypriot (4.7%, a difference of 0.54%), and Zimbabwean (4.8%, a difference of 0.54%).
| Demographics | Rating | Rank | Female Unemployment |
| Immigrants | India | 99.9 /100 | #25 | Exceptional 4.7% |
| Immigrants | Bosnia and Herzegovina | 99.9 /100 | #26 | Exceptional 4.7% |
| British | 99.9 /100 | #27 | Exceptional 4.7% |
| Irish | 99.9 /100 | #28 | Exceptional 4.7% |
| Cypriots | 99.9 /100 | #29 | Exceptional 4.7% |
| Lithuanians | 99.8 /100 | #30 | Exceptional 4.7% |
| Sudanese | 99.8 /100 | #31 | Exceptional 4.8% |
| Slovaks | 99.8 /100 | #32 | Exceptional 4.8% |
| Czechoslovakians | 99.7 /100 | #33 | Exceptional 4.8% |
| Zimbabweans | 99.7 /100 | #34 | Exceptional 4.8% |
| French Canadians | 99.7 /100 | #35 | Exceptional 4.8% |
| Yugoslavians | 99.7 /100 | #36 | Exceptional 4.8% |
| Pennsylvania Germans | 99.6 /100 | #37 | Exceptional 4.8% |
| Northern Europeans | 99.6 /100 | #38 | Exceptional 4.8% |
| Scotch-Irish | 99.6 /100 | #39 | Exceptional 4.8% |