Central American vs Malaysian Unemployment Among Ages 25 to 29 years
COMPARE
Central American
Malaysian
Unemployment Among Ages 25 to 29 years
Unemployment Among Ages 25 to 29 years Comparison
Central Americans
Malaysians
7.0%
UNEMPLOYMENT AMONG AGES 25 TO 29 YEARS
3.0/ 100
METRIC RATING
231st/ 347
METRIC RANK
6.6%
UNEMPLOYMENT AMONG AGES 25 TO 29 YEARS
67.1/ 100
METRIC RATING
149th/ 347
METRIC RANK
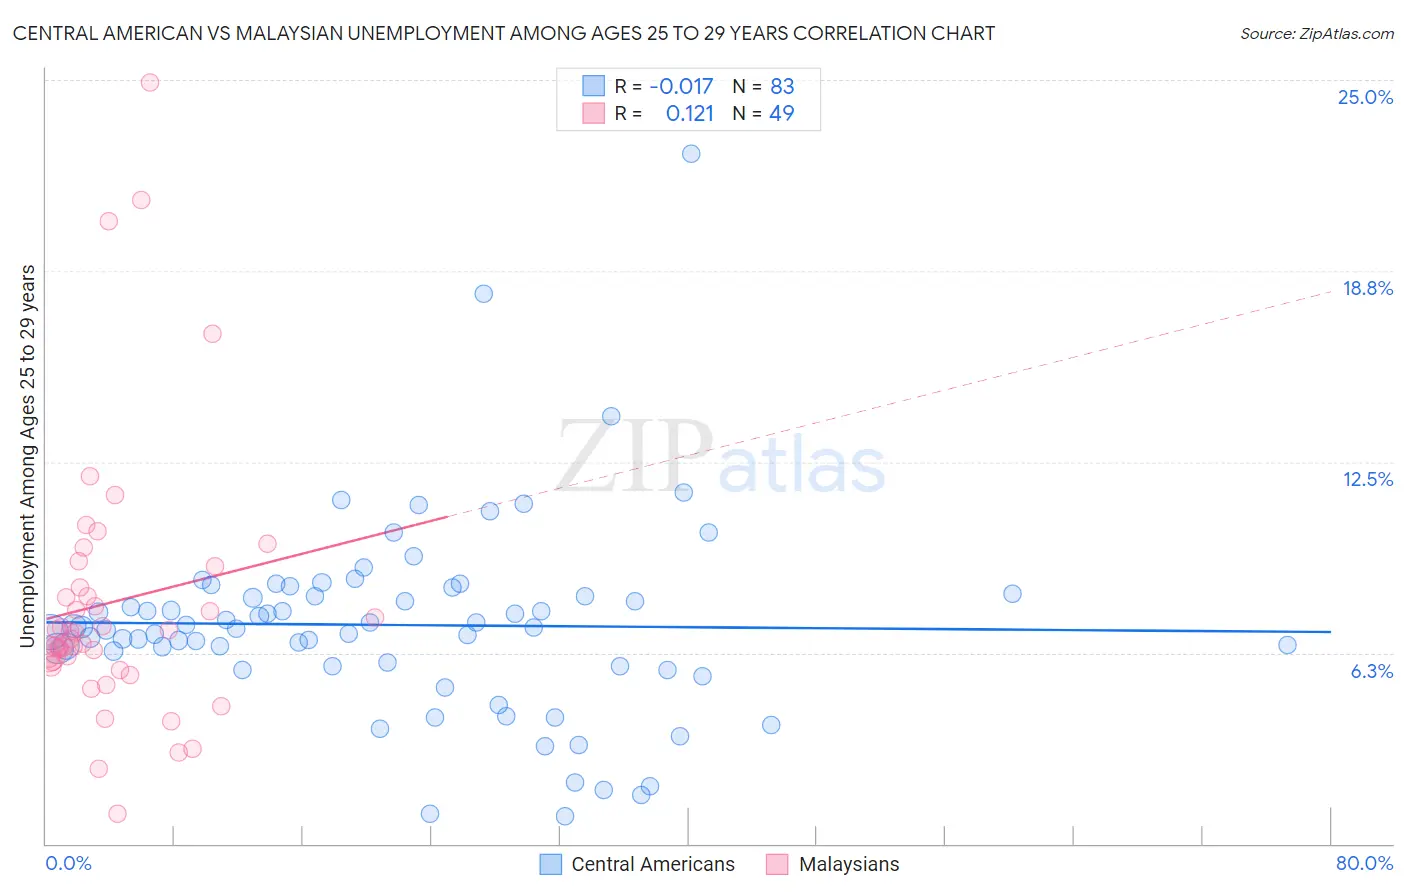
Central American vs Malaysian Unemployment Among Ages 25 to 29 years Correlation Chart
The statistical analysis conducted on geographies consisting of 469,203,667 people shows no correlation between the proportion of Central Americans and unemployment rate among population between the ages 25 and 29 in the United States with a correlation coefficient (R) of -0.017 and weighted average of 7.0%. Similarly, the statistical analysis conducted on geographies consisting of 221,034,519 people shows a poor positive correlation between the proportion of Malaysians and unemployment rate among population between the ages 25 and 29 in the United States with a correlation coefficient (R) of 0.121 and weighted average of 6.6%, a difference of 6.5%.
Unemployment Among Ages 25 to 29 years Correlation Summary
| Measurement | Central American | Malaysian |
| Minimum | 0.90% | 1.0% |
| Maximum | 22.6% | 24.9% |
| Range | 21.7% | 23.9% |
| Mean | 7.2% | 7.9% |
| Median | 7.1% | 6.9% |
| Interquartile 25% (IQ1) | 5.8% | 5.9% |
| Interquartile 75% (IQ3) | 8.2% | 8.8% |
| Interquartile Range (IQR) | 2.4% | 2.8% |
| Standard Deviation (Sample) | 3.2% | 4.5% |
| Standard Deviation (Population) | 3.2% | 4.5% |
Similar Demographics by Unemployment Among Ages 25 to 29 years
Demographics Similar to Central Americans by Unemployment Among Ages 25 to 29 years
In terms of unemployment among ages 25 to 29 years, the demographic groups most similar to Central Americans are Spanish American (7.0%, a difference of 0.15%), Immigrants from El Salvador (7.0%, a difference of 0.29%), Immigrants from Honduras (7.0%, a difference of 0.34%), French Canadian (7.0%, a difference of 0.36%), and Bermudan (7.0%, a difference of 0.37%).
| Demographics | Rating | Rank | Unemployment Among Ages 25 to 29 years |
| Immigrants | Immigrants | 6.2 /100 | #224 | Tragic 6.9% |
| Japanese | 5.4 /100 | #225 | Tragic 6.9% |
| Immigrants | Liberia | 4.8 /100 | #226 | Tragic 7.0% |
| Salvadorans | 4.4 /100 | #227 | Tragic 7.0% |
| Immigrants | Panama | 4.2 /100 | #228 | Tragic 7.0% |
| Bermudans | 3.8 /100 | #229 | Tragic 7.0% |
| Immigrants | El Salvador | 3.6 /100 | #230 | Tragic 7.0% |
| Central Americans | 3.0 /100 | #231 | Tragic 7.0% |
| Spanish Americans | 2.7 /100 | #232 | Tragic 7.0% |
| Immigrants | Honduras | 2.4 /100 | #233 | Tragic 7.0% |
| French Canadians | 2.4 /100 | #234 | Tragic 7.0% |
| Panamanians | 2.1 /100 | #235 | Tragic 7.0% |
| Cape Verdeans | 1.9 /100 | #236 | Tragic 7.0% |
| Puget Sound Salish | 1.8 /100 | #237 | Tragic 7.1% |
| Hondurans | 1.8 /100 | #238 | Tragic 7.1% |
Demographics Similar to Malaysians by Unemployment Among Ages 25 to 29 years
In terms of unemployment among ages 25 to 29 years, the demographic groups most similar to Malaysians are Finnish (6.6%, a difference of 0.010%), Peruvian (6.6%, a difference of 0.070%), Immigrants from Thailand (6.6%, a difference of 0.090%), Ukrainian (6.6%, a difference of 0.12%), and Romanian (6.6%, a difference of 0.17%).
| Demographics | Rating | Rank | Unemployment Among Ages 25 to 29 years |
| Slavs | 72.5 /100 | #142 | Good 6.5% |
| Lithuanians | 72.2 /100 | #143 | Good 6.5% |
| Immigrants | Micronesia | 71.5 /100 | #144 | Good 6.6% |
| Nicaraguans | 70.2 /100 | #145 | Good 6.6% |
| Romanians | 69.5 /100 | #146 | Good 6.6% |
| Immigrants | Thailand | 68.4 /100 | #147 | Good 6.6% |
| Peruvians | 68.1 /100 | #148 | Good 6.6% |
| Malaysians | 67.1 /100 | #149 | Good 6.6% |
| Finns | 66.9 /100 | #150 | Good 6.6% |
| Ukrainians | 65.5 /100 | #151 | Good 6.6% |
| Samoans | 64.6 /100 | #152 | Good 6.6% |
| Immigrants | Italy | 64.4 /100 | #153 | Good 6.6% |
| Colombians | 64.0 /100 | #154 | Good 6.6% |
| Immigrants | Latvia | 63.9 /100 | #155 | Good 6.6% |
| Immigrants | Laos | 63.5 /100 | #156 | Good 6.6% |