Central American Indian vs Puerto Rican Unemployment Among Women with Children Ages 6 to 17 years
COMPARE
Central American Indian
Puerto Rican
Unemployment Among Women with Children Ages 6 to 17 years
Unemployment Among Women with Children Ages 6 to 17 years Comparison
Central American Indians
Puerto Ricans
9.9%
UNEMPLOYMENT AMONG WOMEN WITH CHILDREN AGES 6 TO 17 YEARS
0.0/ 100
METRIC RATING
283rd/ 347
METRIC RANK
13.9%
UNEMPLOYMENT AMONG WOMEN WITH CHILDREN AGES 6 TO 17 YEARS
0.0/ 100
METRIC RATING
340th/ 347
METRIC RANK
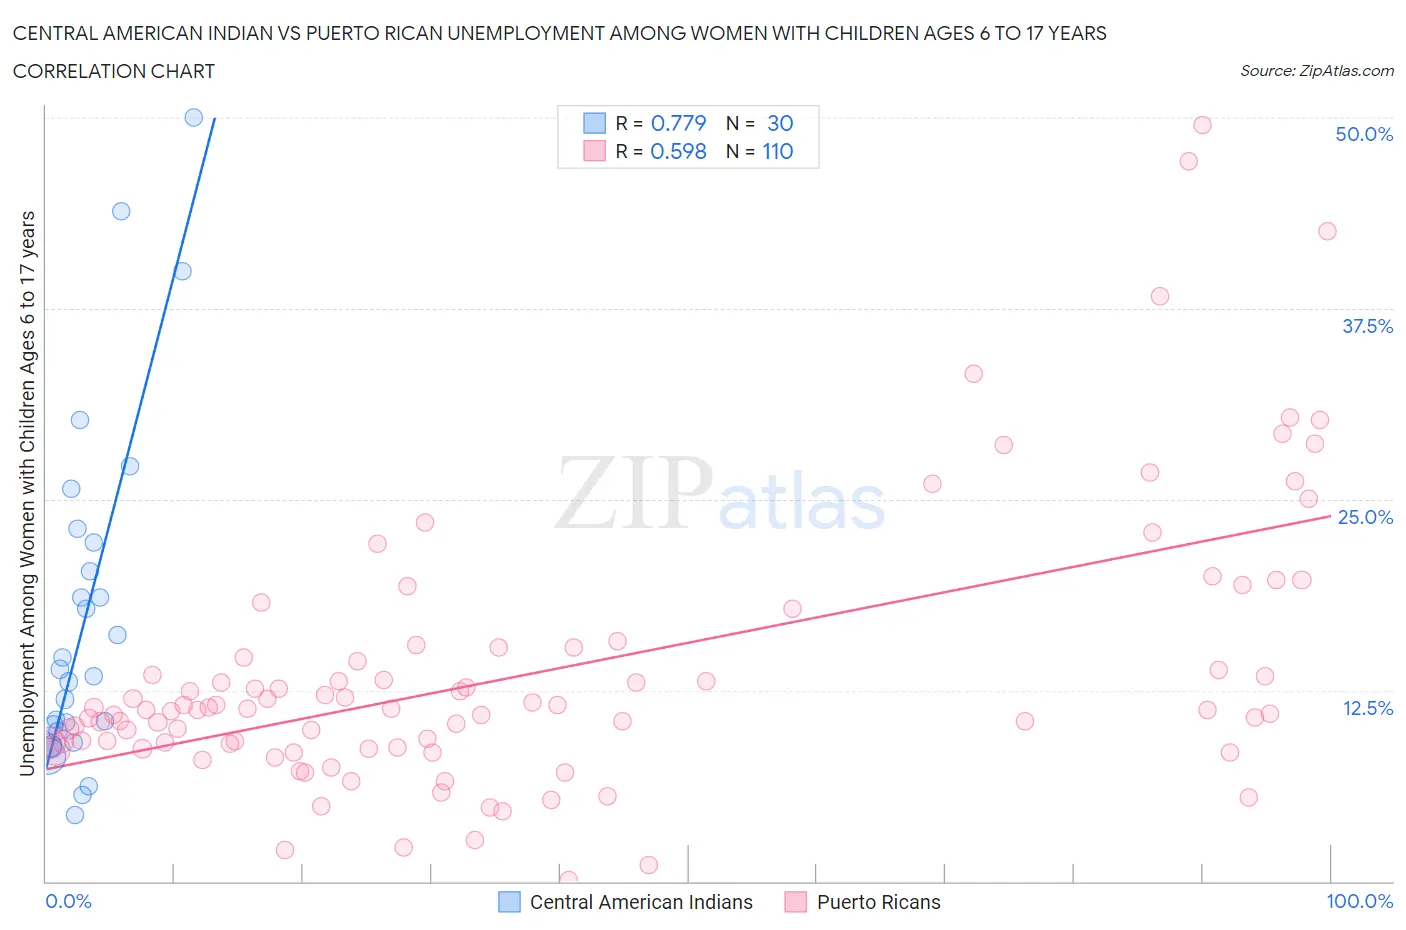
Central American Indian vs Puerto Rican Unemployment Among Women with Children Ages 6 to 17 years Correlation Chart
The statistical analysis conducted on geographies consisting of 253,474,546 people shows a strong positive correlation between the proportion of Central American Indians and unemployment rate among women with children between the ages 6 and 17 in the United States with a correlation coefficient (R) of 0.779 and weighted average of 9.9%. Similarly, the statistical analysis conducted on geographies consisting of 349,926,065 people shows a substantial positive correlation between the proportion of Puerto Ricans and unemployment rate among women with children between the ages 6 and 17 in the United States with a correlation coefficient (R) of 0.598 and weighted average of 13.9%, a difference of 40.4%.
Unemployment Among Women with Children Ages 6 to 17 years Correlation Summary
| Measurement | Central American Indian | Puerto Rican |
| Minimum | 4.3% | 0.10% |
| Maximum | 50.0% | 49.5% |
| Range | 45.7% | 49.4% |
| Mean | 17.4% | 13.7% |
| Median | 13.6% | 11.3% |
| Interquartile 25% (IQ1) | 9.9% | 9.0% |
| Interquartile 75% (IQ3) | 22.2% | 15.3% |
| Interquartile Range (IQR) | 12.3% | 6.3% |
| Standard Deviation (Sample) | 11.4% | 8.9% |
| Standard Deviation (Population) | 11.2% | 8.9% |
Similar Demographics by Unemployment Among Women with Children Ages 6 to 17 years
Demographics Similar to Central American Indians by Unemployment Among Women with Children Ages 6 to 17 years
In terms of unemployment among women with children ages 6 to 17 years, the demographic groups most similar to Central American Indians are Yakama (9.9%, a difference of 0.15%), Hispanic or Latino (9.9%, a difference of 0.46%), Choctaw (9.9%, a difference of 0.58%), Sierra Leonean (9.9%, a difference of 0.63%), and Slovak (9.8%, a difference of 0.83%).
| Demographics | Rating | Rank | Unemployment Among Women with Children Ages 6 to 17 years |
| Immigrants | Portugal | 0.1 /100 | #276 | Tragic 9.7% |
| British West Indians | 0.1 /100 | #277 | Tragic 9.7% |
| French | 0.1 /100 | #278 | Tragic 9.7% |
| Scotch-Irish | 0.1 /100 | #279 | Tragic 9.7% |
| Seminole | 0.1 /100 | #280 | Tragic 9.7% |
| Jamaicans | 0.0 /100 | #281 | Tragic 9.8% |
| Slovaks | 0.0 /100 | #282 | Tragic 9.8% |
| Central American Indians | 0.0 /100 | #283 | Tragic 9.9% |
| Yakama | 0.0 /100 | #284 | Tragic 9.9% |
| Hispanics or Latinos | 0.0 /100 | #285 | Tragic 9.9% |
| Choctaw | 0.0 /100 | #286 | Tragic 9.9% |
| Sierra Leoneans | 0.0 /100 | #287 | Tragic 9.9% |
| Shoshone | 0.0 /100 | #288 | Tragic 10.0% |
| Hondurans | 0.0 /100 | #289 | Tragic 10.0% |
| Sub-Saharan Africans | 0.0 /100 | #290 | Tragic 10.0% |
Demographics Similar to Puerto Ricans by Unemployment Among Women with Children Ages 6 to 17 years
In terms of unemployment among women with children ages 6 to 17 years, the demographic groups most similar to Puerto Ricans are Navajo (14.2%, a difference of 2.1%), Sioux (13.2%, a difference of 4.8%), Yuman (14.8%, a difference of 6.8%), Inupiat (14.9%, a difference of 7.1%), and Hopi (12.9%, a difference of 7.5%).
| Demographics | Rating | Rank | Unemployment Among Women with Children Ages 6 to 17 years |
| Natives/Alaskans | 0.0 /100 | #333 | Tragic 11.5% |
| Ugandans | 0.0 /100 | #334 | Tragic 12.0% |
| Colville | 0.0 /100 | #335 | Tragic 12.3% |
| Houma | 0.0 /100 | #336 | Tragic 12.5% |
| Immigrants | Yemen | 0.0 /100 | #337 | Tragic 12.7% |
| Hopi | 0.0 /100 | #338 | Tragic 12.9% |
| Sioux | 0.0 /100 | #339 | Tragic 13.2% |
| Puerto Ricans | 0.0 /100 | #340 | Tragic 13.9% |
| Navajo | 0.0 /100 | #341 | Tragic 14.2% |
| Yuman | 0.0 /100 | #342 | Tragic 14.8% |
| Inupiat | 0.0 /100 | #343 | Tragic 14.9% |
| Cheyenne | 0.0 /100 | #344 | Tragic 16.4% |
| Arapaho | 0.0 /100 | #345 | Tragic 16.8% |
| Yup'ik | 0.0 /100 | #346 | Tragic 18.6% |
| Pima | 0.0 /100 | #347 | Tragic 18.9% |