Central American Indian vs Indian (Asian) Unemployment
COMPARE
Central American Indian
Indian (Asian)
Unemployment
Unemployment Comparison
Central American Indians
Indians (Asian)
6.2%
UNEMPLOYMENT
0.0/ 100
METRIC RATING
292nd/ 347
METRIC RANK
5.1%
UNEMPLOYMENT
81.6/ 100
METRIC RATING
147th/ 347
METRIC RANK
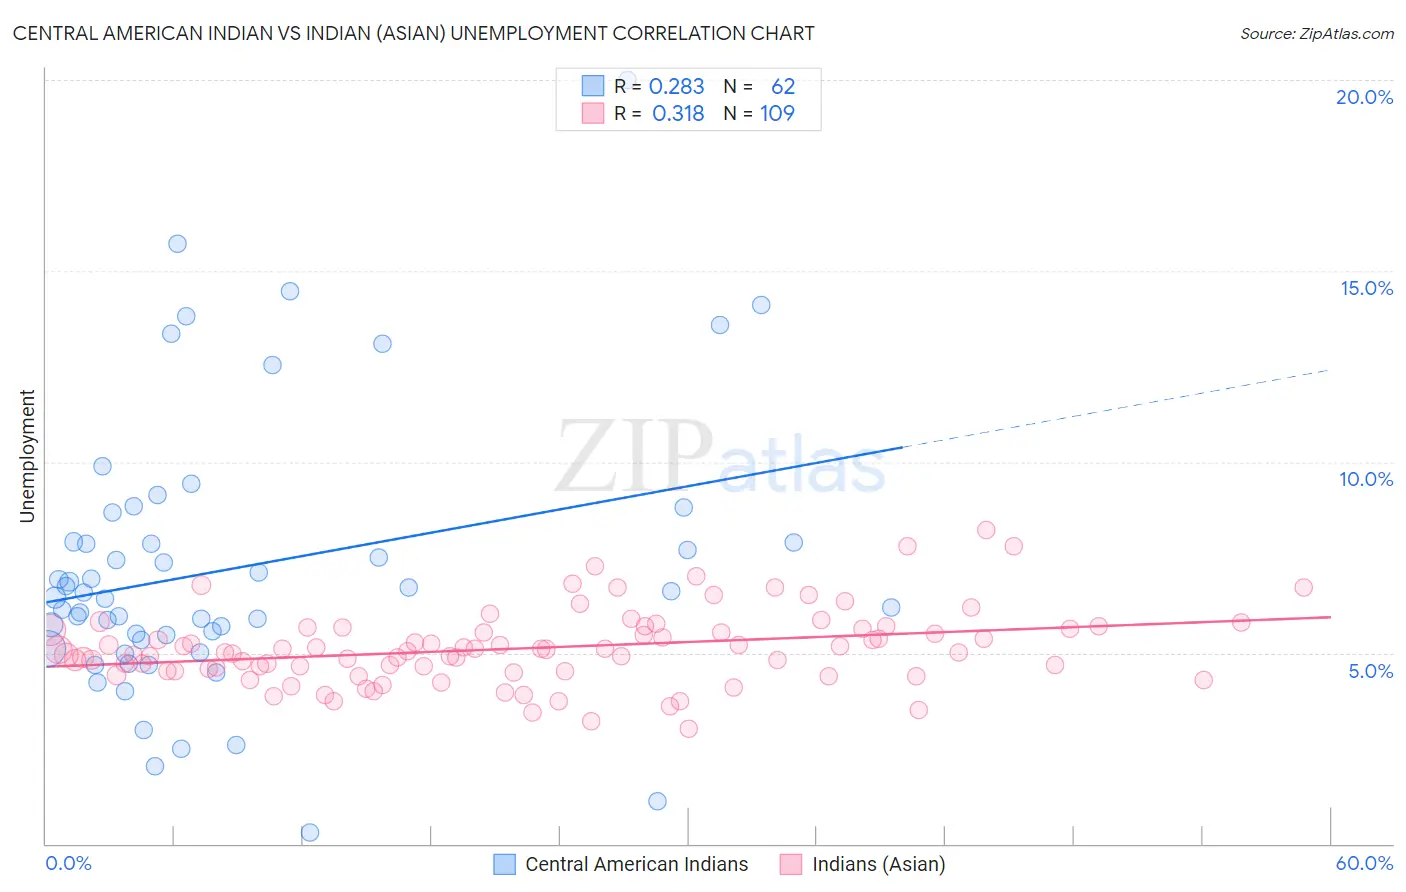
Central American Indian vs Indian (Asian) Unemployment Correlation Chart
The statistical analysis conducted on geographies consisting of 325,961,025 people shows a weak positive correlation between the proportion of Central American Indians and unemployment in the United States with a correlation coefficient (R) of 0.283 and weighted average of 6.2%. Similarly, the statistical analysis conducted on geographies consisting of 494,388,692 people shows a mild positive correlation between the proportion of Indians (Asian) and unemployment in the United States with a correlation coefficient (R) of 0.318 and weighted average of 5.1%, a difference of 21.4%.
Unemployment Correlation Summary
| Measurement | Central American Indian | Indian (Asian) |
| Minimum | 0.30% | 3.0% |
| Maximum | 20.0% | 8.2% |
| Range | 19.7% | 5.2% |
| Mean | 7.2% | 5.1% |
| Median | 6.5% | 5.0% |
| Interquartile 25% (IQ1) | 5.3% | 4.5% |
| Interquartile 75% (IQ3) | 7.9% | 5.6% |
| Interquartile Range (IQR) | 2.6% | 1.1% |
| Standard Deviation (Sample) | 3.6% | 0.97% |
| Standard Deviation (Population) | 3.6% | 0.96% |
Similar Demographics by Unemployment
Demographics Similar to Central American Indians by Unemployment
In terms of unemployment, the demographic groups most similar to Central American Indians are Haitian (6.2%, a difference of 0.020%), Immigrants from Ecuador (6.2%, a difference of 0.090%), Spanish American Indian (6.2%, a difference of 0.090%), U.S. Virgin Islander (6.3%, a difference of 0.22%), and Senegalese (6.2%, a difference of 0.54%).
| Demographics | Rating | Rank | Unemployment |
| Immigrants | Senegal | 0.0 /100 | #285 | Tragic 6.1% |
| Immigrants | Caribbean | 0.0 /100 | #286 | Tragic 6.2% |
| Nepalese | 0.0 /100 | #287 | Tragic 6.2% |
| Ecuadorians | 0.0 /100 | #288 | Tragic 6.2% |
| Chippewa | 0.0 /100 | #289 | Tragic 6.2% |
| Senegalese | 0.0 /100 | #290 | Tragic 6.2% |
| Haitians | 0.0 /100 | #291 | Tragic 6.2% |
| Central American Indians | 0.0 /100 | #292 | Tragic 6.2% |
| Immigrants | Ecuador | 0.0 /100 | #293 | Tragic 6.2% |
| Spanish American Indians | 0.0 /100 | #294 | Tragic 6.2% |
| U.S. Virgin Islanders | 0.0 /100 | #295 | Tragic 6.3% |
| Ute | 0.0 /100 | #296 | Tragic 6.3% |
| Jamaicans | 0.0 /100 | #297 | Tragic 6.3% |
| Immigrants | Haiti | 0.0 /100 | #298 | Tragic 6.3% |
| Immigrants | West Indies | 0.0 /100 | #299 | Tragic 6.3% |
Demographics Similar to Indians (Asian) by Unemployment
In terms of unemployment, the demographic groups most similar to Indians (Asian) are Immigrants from Asia (5.1%, a difference of 0.010%), Immigrants from Norway (5.1%, a difference of 0.020%), Indonesian (5.1%, a difference of 0.070%), Immigrants from Chile (5.1%, a difference of 0.12%), and Immigrants from Pakistan (5.1%, a difference of 0.17%).
| Demographics | Rating | Rank | Unemployment |
| Immigrants | Denmark | 84.3 /100 | #140 | Excellent 5.1% |
| Palestinians | 83.4 /100 | #141 | Excellent 5.1% |
| Immigrants | Pakistan | 83.2 /100 | #142 | Excellent 5.1% |
| Immigrants | Chile | 82.8 /100 | #143 | Excellent 5.1% |
| Indonesians | 82.3 /100 | #144 | Excellent 5.1% |
| Immigrants | Norway | 81.8 /100 | #145 | Excellent 5.1% |
| Immigrants | Asia | 81.8 /100 | #146 | Excellent 5.1% |
| Indians (Asian) | 81.6 /100 | #147 | Excellent 5.1% |
| Immigrants | Italy | 79.1 /100 | #148 | Good 5.1% |
| Syrians | 77.7 /100 | #149 | Good 5.2% |
| Potawatomi | 76.2 /100 | #150 | Good 5.2% |
| Immigrants | Eastern Europe | 75.3 /100 | #151 | Good 5.2% |
| Immigrants | Hong Kong | 75.2 /100 | #152 | Good 5.2% |
| Egyptians | 75.2 /100 | #153 | Good 5.2% |
| Immigrants | China | 74.7 /100 | #154 | Good 5.2% |