Immigrants from Sri Lanka vs Immigrants from Taiwan Unemployment Among Ages 20 to 24 years
COMPARE
Immigrants from Sri Lanka
Immigrants from Taiwan
Unemployment Among Ages 20 to 24 years
Unemployment Among Ages 20 to 24 years Comparison
Immigrants from Sri Lanka
Immigrants from Taiwan
10.5%
UNEMPLOYMENT AMONG AGES 20 TO 24 YEARS
14.0/ 100
METRIC RATING
212th/ 347
METRIC RANK
10.2%
UNEMPLOYMENT AMONG AGES 20 TO 24 YEARS
71.4/ 100
METRIC RATING
153rd/ 347
METRIC RANK
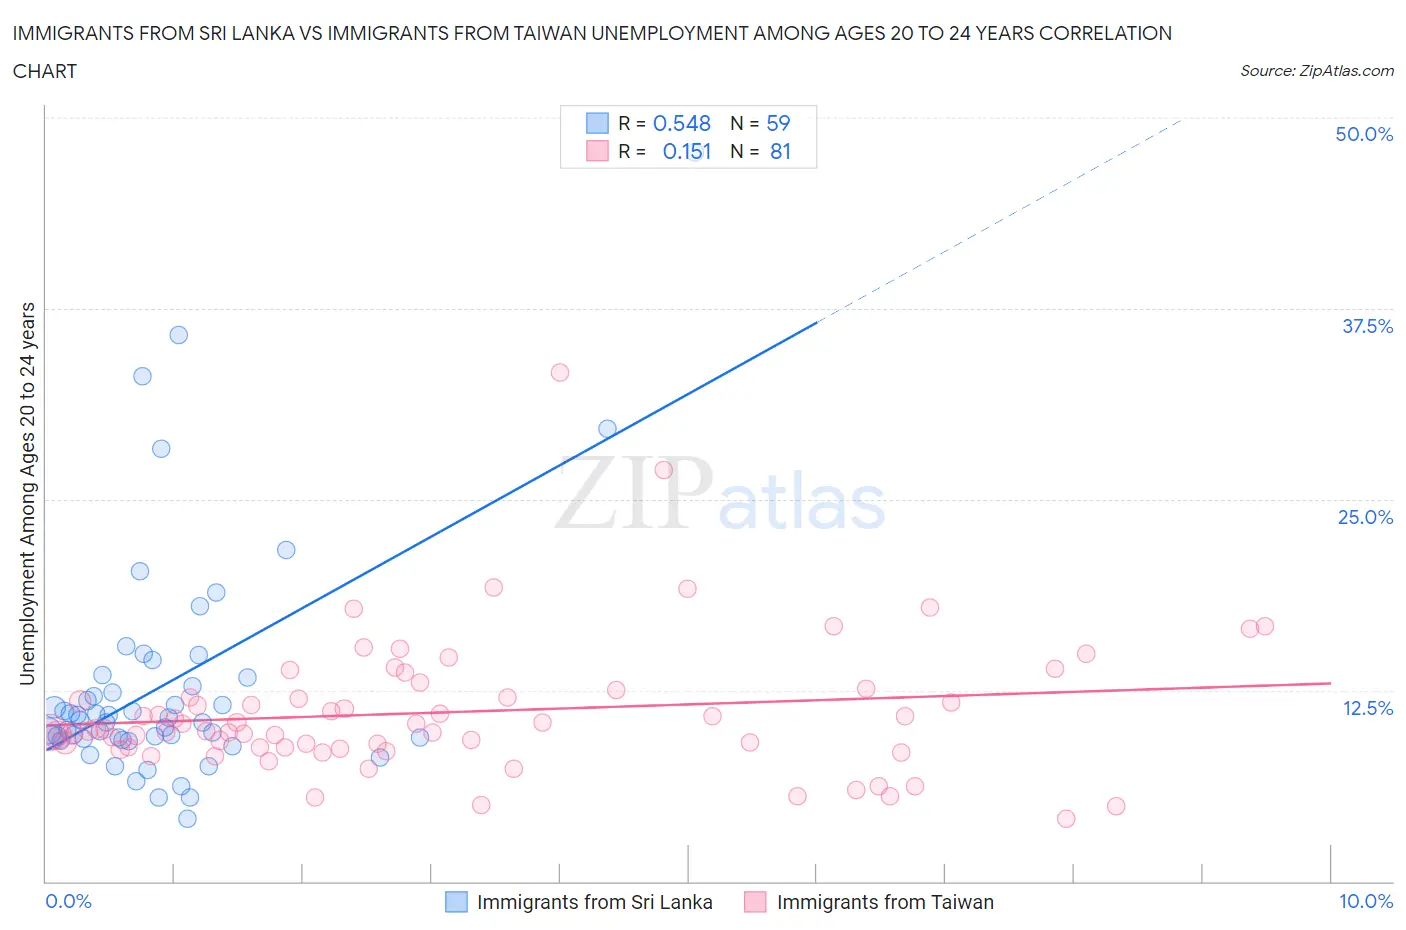
Immigrants from Sri Lanka vs Immigrants from Taiwan Unemployment Among Ages 20 to 24 years Correlation Chart
The statistical analysis conducted on geographies consisting of 148,758,891 people shows a substantial positive correlation between the proportion of Immigrants from Sri Lanka and unemployment rate among population between the ages 20 and 24 in the United States with a correlation coefficient (R) of 0.548 and weighted average of 10.5%. Similarly, the statistical analysis conducted on geographies consisting of 292,759,634 people shows a poor positive correlation between the proportion of Immigrants from Taiwan and unemployment rate among population between the ages 20 and 24 in the United States with a correlation coefficient (R) of 0.151 and weighted average of 10.2%, a difference of 2.5%.
Unemployment Among Ages 20 to 24 years Correlation Summary
| Measurement | Immigrants from Sri Lanka | Immigrants from Taiwan |
| Minimum | 4.1% | 4.1% |
| Maximum | 47.7% | 33.3% |
| Range | 43.6% | 29.2% |
| Mean | 12.9% | 11.1% |
| Median | 10.6% | 9.9% |
| Interquartile 25% (IQ1) | 9.4% | 8.8% |
| Interquartile 75% (IQ3) | 13.3% | 12.3% |
| Interquartile Range (IQR) | 3.9% | 3.5% |
| Standard Deviation (Sample) | 7.8% | 4.5% |
| Standard Deviation (Population) | 7.7% | 4.5% |
Similar Demographics by Unemployment Among Ages 20 to 24 years
Demographics Similar to Immigrants from Sri Lanka by Unemployment Among Ages 20 to 24 years
In terms of unemployment among ages 20 to 24 years, the demographic groups most similar to Immigrants from Sri Lanka are Immigrants from Guatemala (10.5%, a difference of 0.040%), Guatemalan (10.5%, a difference of 0.14%), Kiowa (10.5%, a difference of 0.18%), Immigrants from Belgium (10.5%, a difference of 0.20%), and Peruvian (10.5%, a difference of 0.22%).
| Demographics | Rating | Rank | Unemployment Among Ages 20 to 24 years |
| Cypriots | 18.9 /100 | #205 | Poor 10.4% |
| Immigrants | Europe | 18.5 /100 | #206 | Poor 10.4% |
| Immigrants | Honduras | 17.9 /100 | #207 | Poor 10.4% |
| Immigrants | Hong Kong | 17.6 /100 | #208 | Poor 10.5% |
| Peruvians | 17.2 /100 | #209 | Poor 10.5% |
| Immigrants | Belgium | 16.9 /100 | #210 | Poor 10.5% |
| Immigrants | Guatemala | 14.6 /100 | #211 | Poor 10.5% |
| Immigrants | Sri Lanka | 14.0 /100 | #212 | Poor 10.5% |
| Guatemalans | 12.2 /100 | #213 | Poor 10.5% |
| Kiowa | 11.7 /100 | #214 | Poor 10.5% |
| Hondurans | 10.5 /100 | #215 | Poor 10.5% |
| Costa Ricans | 9.6 /100 | #216 | Tragic 10.5% |
| Cherokee | 9.3 /100 | #217 | Tragic 10.5% |
| Immigrants | Nonimmigrants | 8.8 /100 | #218 | Tragic 10.5% |
| Immigrants | Southern Europe | 8.0 /100 | #219 | Tragic 10.5% |
Demographics Similar to Immigrants from Taiwan by Unemployment Among Ages 20 to 24 years
In terms of unemployment among ages 20 to 24 years, the demographic groups most similar to Immigrants from Taiwan are Immigrants from Switzerland (10.2%, a difference of 0.010%), Iranian (10.2%, a difference of 0.040%), Lithuanian (10.2%, a difference of 0.060%), Immigrants from South Africa (10.2%, a difference of 0.10%), and Hungarian (10.2%, a difference of 0.14%).
| Demographics | Rating | Rank | Unemployment Among Ages 20 to 24 years |
| Asians | 77.7 /100 | #146 | Good 10.2% |
| French Canadians | 77.5 /100 | #147 | Good 10.2% |
| Immigrants | Romania | 75.7 /100 | #148 | Good 10.2% |
| Immigrants | Scotland | 74.6 /100 | #149 | Good 10.2% |
| Hungarians | 74.4 /100 | #150 | Good 10.2% |
| Immigrants | South Africa | 73.6 /100 | #151 | Good 10.2% |
| Iranians | 72.4 /100 | #152 | Good 10.2% |
| Immigrants | Taiwan | 71.4 /100 | #153 | Good 10.2% |
| Immigrants | Switzerland | 71.3 /100 | #154 | Good 10.2% |
| Lithuanians | 70.0 /100 | #155 | Good 10.2% |
| Canadians | 66.7 /100 | #156 | Good 10.2% |
| Immigrants | Uganda | 65.6 /100 | #157 | Good 10.2% |
| Immigrants | Kazakhstan | 65.5 /100 | #158 | Good 10.2% |
| Immigrants | England | 63.7 /100 | #159 | Good 10.3% |
| Spaniards | 63.4 /100 | #160 | Good 10.3% |