Immigrants from Pakistan vs Immigrants from Morocco Unemployment Among Ages 60 to 64 years

COMPARE

Immigrants from Pakistan
Race
Ancestry
AfghanAfricanAlaska NativeAlaskan AthabascanAlbanianAleutAlsatianAmericanApacheArabArapahoArgentineanArmenianAssyrian/Chaldean/SyriacAustralianAustrianBahamianBangladeshiBarbadianBasqueBelgianBelizeanBermudanBhutaneseBlackfeetBolivianBrazilianBritishBritish West IndianBulgarianBurmeseCajunCambodianCanadianCape VerdeanCarpatho RusynCelticCentral AmericanCentral American IndianCherokeeCheyenneChickasawChileanChineseChippewaChoctawColombianColvilleComancheCosta RicanCreeCreekCroatianCrowCubanCypriotCzechCzechoslovakianDanishDelawareDominicanDutchDutch West IndianEastern EuropeanEcuadorianEgyptianEnglishEstonianEthiopianEuropeanFijianFilipinoFinnishFrenchFrench American IndianFrench CanadianGermanGerman RussianGhanaianGreekGuamanian/ChamorroGuatemalanGuyaneseHaitianHmongHonduranHopiHoumaHungarianIcelanderIndian (Asian)IndonesianInupiatIranianIraqiIrishIroquoisIsraeliItalianJamaicanJapaneseJordanianKenyanKiowaKoreanLaotianLatvianLebaneseLiberianLithuanianLumbeeLuxembourgerMacedonianMalaysianMalteseMarshalleseMenomineeMexicanMexican American IndianMongolianMoroccanNative HawaiianNavajoNepaleseNew ZealanderNicaraguanNigerianNorthern EuropeanNorwegianOkinawanOsageOttawaPaiutePakistaniPalestinianPanamanianParaguayanPennsylvania GermanPeruvianPimaPolishPortuguesePotawatomiPuebloPuerto RicanPuget Sound SalishRomanianRussianSalvadoranSamoanScandinavianScotch-IrishScottishSeminoleSenegaleseSerbianShoshoneSierra LeoneanSiouxSlavicSlovakSloveneSomaliSouth AfricanSouth AmericanSouth American IndianSoviet UnionSpaniardSpanishSpanish AmericanSpanish American IndianSri LankanSubsaharan AfricanSudaneseSwedishSwissSyrianTaiwaneseThaiTlingit-HaidaTohono O'OdhamTonganTrinidadian and TobagonianTsimshianTurkishU.S. Virgin IslanderUgandanUkrainianUruguayanUteVenezuelanVietnameseWelshWest IndianYakamaYaquiYugoslavianYumanYup'ikZimbabwean
Immigration
NonimmigrantsImmigrantsAfghanistanAfricaAlbaniaArgentinaArmeniaAsiaAustraliaAustriaBahamasBangladeshBarbadosBelarusBelgiumBelizeBoliviaBosnia and HerzegovinaBrazilBulgariaBurma/MyanmarCabo VerdeCambodiaCameroonCanadaCaribbeanCentral AmericaChileChinaColombiaCongoCosta RicaCroatiaCubaCzechoslovakiaDenmarkDominicaDominican RepublicEastern AfricaEastern AsiaEastern EuropeEcuadorEgyptEl SalvadorEnglandEritreaEthiopiaEuropeFijiFranceGermanyGhanaGreeceGrenadaGuatemalaGuyanaHaitiHondurasHong KongHungaryIndiaIndonesiaIranIraqIrelandIsraelItalyJamaicaJapanJordanKazakhstanKenyaKoreaKuwaitLaosLatin AmericaLatviaLebanonLiberiaLithuaniaMalaysiaMexicoMicronesiaMiddle AfricaMoldovaNepalNetherlandsNicaraguaNigeriaNorth AmericaNorth MacedoniaNorthern AfricaNorthern EuropeNorwayOceaniaPakistanPanamaPeruPhilippinesPolandPortugalRomaniaRussiaSaudi ArabiaScotlandSenegalSerbiaSierra LeoneSingaporeSomaliaSouth AfricaSouth AmericaSouth Central AsiaSouth Eastern AsiaSouthern EuropeSpainSri LankaSt. Vincent and the GrenadinesSudanSwedenSwitzerlandSyriaTaiwanThailandTrinidad and TobagoTurkeyUgandaUkraineUruguayUzbekistanVenezuelaVietnamWest IndiesWestern AfricaWestern AsiaWestern EuropeYemenZaireZimbabweAzores
Immigrants from Morocco
Race
Ancestry
AfghanAfricanAlaska NativeAlaskan AthabascanAlbanianAleutAlsatianAmericanApacheArabArapahoArgentineanArmenianAssyrian/Chaldean/SyriacAustralianAustrianBahamianBangladeshiBarbadianBasqueBelgianBelizeanBermudanBhutaneseBlackfeetBolivianBrazilianBritishBritish West IndianBulgarianBurmeseCajunCambodianCanadianCape VerdeanCarpatho RusynCelticCentral AmericanCentral American IndianCherokeeCheyenneChickasawChileanChineseChippewaChoctawColombianColvilleComancheCosta RicanCreeCreekCroatianCrowCubanCypriotCzechCzechoslovakianDanishDelawareDominicanDutchDutch West IndianEastern EuropeanEcuadorianEgyptianEnglishEstonianEthiopianEuropeanFijianFilipinoFinnishFrenchFrench American IndianFrench CanadianGermanGerman RussianGhanaianGreekGuamanian/ChamorroGuatemalanGuyaneseHaitianHmongHonduranHopiHoumaHungarianIcelanderIndian (Asian)IndonesianInupiatIranianIraqiIrishIroquoisIsraeliItalianJamaicanJapaneseJordanianKenyanKiowaKoreanLaotianLatvianLebaneseLiberianLithuanianLumbeeLuxembourgerMacedonianMalaysianMalteseMarshalleseMenomineeMexicanMexican American IndianMongolianMoroccanNative HawaiianNavajoNepaleseNew ZealanderNicaraguanNigerianNorthern EuropeanNorwegianOkinawanOsageOttawaPaiutePakistaniPalestinianPanamanianParaguayanPennsylvania GermanPeruvianPimaPolishPortuguesePotawatomiPuebloPuerto RicanPuget Sound SalishRomanianRussianSalvadoranSamoanScandinavianScotch-IrishScottishSeminoleSenegaleseSerbianShoshoneSierra LeoneanSiouxSlavicSlovakSloveneSomaliSouth AfricanSouth AmericanSouth American IndianSoviet UnionSpaniardSpanishSpanish AmericanSpanish American IndianSri LankanSubsaharan AfricanSudaneseSwedishSwissSyrianTaiwaneseThaiTlingit-HaidaTohono O'OdhamTonganTrinidadian and TobagonianTsimshianTurkishU.S. Virgin IslanderUgandanUkrainianUruguayanUteVenezuelanVietnameseWelshWest IndianYakamaYaquiYugoslavianYumanYup'ikZimbabwean
Immigration
NonimmigrantsImmigrantsAfghanistanAfricaAlbaniaArgentinaArmeniaAsiaAustraliaAustriaBahamasBangladeshBarbadosBelarusBelgiumBelizeBoliviaBosnia and HerzegovinaBrazilBulgariaBurma/MyanmarCabo VerdeCambodiaCameroonCanadaCaribbeanCentral AmericaChileChinaColombiaCongoCosta RicaCroatiaCubaCzechoslovakiaDenmarkDominicaDominican RepublicEastern AfricaEastern AsiaEastern EuropeEcuadorEgyptEl SalvadorEnglandEritreaEthiopiaEuropeFijiFranceGermanyGhanaGreeceGrenadaGuatemalaGuyanaHaitiHondurasHong KongHungaryIndiaIndonesiaIranIraqIrelandIsraelItalyJamaicaJapanJordanKazakhstanKenyaKoreaKuwaitLaosLatin AmericaLatviaLebanonLiberiaLithuaniaMalaysiaMexicoMicronesiaMiddle AfricaMoldovaMoroccoNepalNetherlandsNicaraguaNigeriaNorth AmericaNorth MacedoniaNorthern AfricaNorthern EuropeNorwayOceaniaPanamaPeruPhilippinesPolandPortugalRomaniaRussiaSaudi ArabiaScotlandSenegalSerbiaSierra LeoneSingaporeSomaliaSouth AfricaSouth AmericaSouth Central AsiaSouth Eastern AsiaSouthern EuropeSpainSri LankaSt. Vincent and the GrenadinesSudanSwedenSwitzerlandSyriaTaiwanThailandTrinidad and TobagoTurkeyUgandaUkraineUruguayUzbekistanVenezuelaVietnamWest IndiesWestern AfricaWestern AsiaWestern EuropeYemenZaireZimbabweAzores
Unemployment Among Ages 60 to 64 years
Income
Poverty
Unemployment
Labor Participation
Family Structure
Vehicle Availability
Education Level
Disability

Unemployment Among Ages 60 to 64 years Comparison

Immigrants from Pakistan

Immigrants from Morocco

Excellent
Exceptional
4.8%
UNEMPLOYMENT AMONG AGES 60 TO 64 YEARS
83.3/ 100
METRIC RATING
144th/ 347
METRIC RANK
4.7%
UNEMPLOYMENT AMONG AGES 60 TO 64 YEARS
95.7/ 100
METRIC RATING
119th/ 347
METRIC RANK

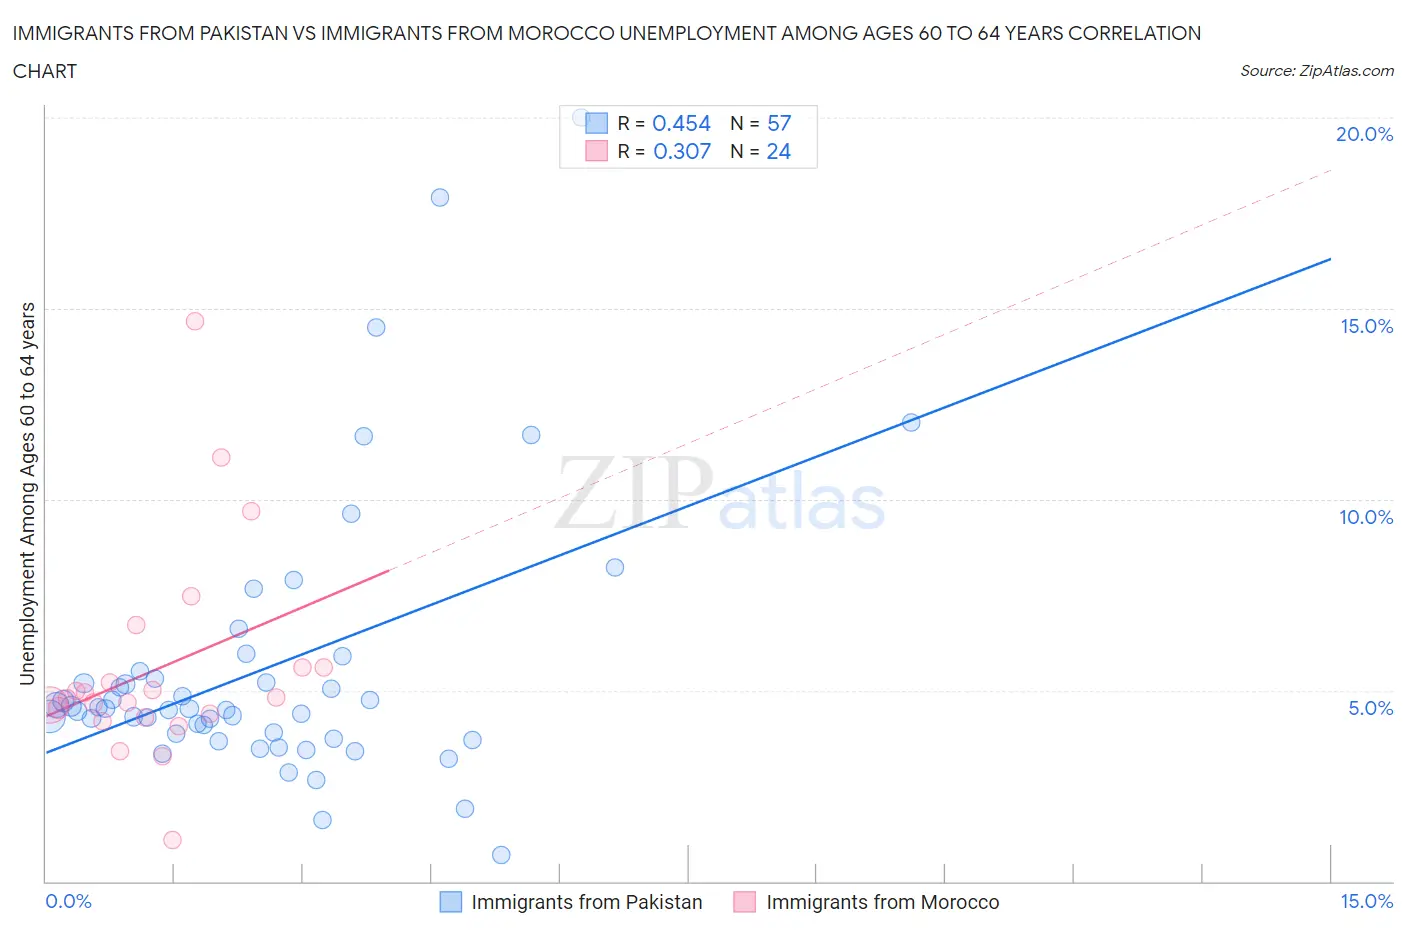
Immigrants from Pakistan vs Immigrants from Morocco Unemployment Among Ages 60 to 64 years Correlation Chart

The statistical analysis conducted on geographies consisting of 267,638,275 people shows a moderate positive correlation between the proportion of Immigrants from Pakistan and unemployment rate among population between the ages 60 and 64 in the United States with a correlation coefficient (R) of 0.454 and weighted average of 4.8%. Similarly, the statistical analysis conducted on geographies consisting of 172,914,481 people shows a mild positive correlation between the proportion of Immigrants from Morocco and unemployment rate among population between the ages 60 and 64 in the United States with a correlation coefficient (R) of 0.307 and weighted average of 4.7%, a difference of 1.4%.
Immigrants from Pakistan vs Immigrants from Morocco Unemployment Among Ages 60 to 64 years

Unemployment Among Ages 60 to 64 years Correlation Summary

MeasurementImmigrants from PakistanImmigrants from Morocco
Minimum0.70%1.1%
Maximum20.0%14.7%
Range19.3%13.6%
Mean5.6%5.6%
Median4.5%4.8%
Interquartile 25% (IQ1)3.8%4.3%
Interquartile 75% (IQ3)5.4%5.6%
Interquartile Range (IQR)1.6%1.3%
Standard Deviation (Sample)3.6%2.8%
Standard Deviation (Population)3.6%2.7%

Similar Demographics by Unemployment Among Ages 60 to 64 years

Demographics Similar to Immigrants from Pakistan by Unemployment Among Ages 60 to 64 years

In terms of unemployment among ages 60 to 64 years, the demographic groups most similar to Immigrants from Pakistan are Burmese (4.8%, a difference of 0.010%), Turkish (4.8%, a difference of 0.090%), Italian (4.8%, a difference of 0.11%), Mongolian (4.8%, a difference of 0.13%), and Immigrants from Ethiopia (4.8%, a difference of 0.14%).
DemographicsRating | RankUnemployment Among Ages 60 to 64 years
Cambodians
86.9
/100
|
#137
Excellent
4.8%
Immigrants | Lithuania
86.7
/100
|
#138
Excellent
4.8%
Immigrants | Africa
86.6
/100
|
#139
Excellent
4.8%
Pima
85.8
/100
|
#140
Excellent
4.8%
Panamanians
85.5
/100
|
#141
Excellent
4.8%
Immigrants | Ethiopia
85.3
/100
|
#142
Excellent
4.8%
Italians
85.0
/100
|
#143
Excellent
4.8%
Immigrants | Pakistan
83.3
/100
|
#144
Excellent
4.8%
Burmese
83.1
/100
|
#145
Excellent
4.8%
Turks
81.9
/100
|
#146
Excellent
4.8%
Mongolians
81.2
/100
|
#147
Excellent
4.8%
Latvians
79.1
/100
|
#148
Good
4.8%
Arabs
78.8
/100
|
#149
Good
4.8%
Immigrants | Italy
78.7
/100
|
#150
Good
4.8%
Immigrants | South Africa
78.5
/100
|
#151
Good
4.8%

Demographics Similar to Immigrants from Morocco by Unemployment Among Ages 60 to 64 years

In terms of unemployment among ages 60 to 64 years, the demographic groups most similar to Immigrants from Morocco are Macedonian (4.7%, a difference of 0.010%), Ukrainian (4.7%, a difference of 0.090%), Albanian (4.7%, a difference of 0.090%), Immigrants from Kazakhstan (4.7%, a difference of 0.12%), and Immigrants from England (4.7%, a difference of 0.14%).
DemographicsRating | RankUnemployment Among Ages 60 to 64 years
Syrians
97.0
/100
|
#112
Exceptional
4.7%
Bulgarians
96.6
/100
|
#113
Exceptional
4.7%
Maltese
96.5
/100
|
#114
Exceptional
4.7%
Immigrants | Romania
96.4
/100
|
#115
Exceptional
4.7%
Immigrants | England
96.3
/100
|
#116
Exceptional
4.7%
Immigrants | Germany
96.3
/100
|
#117
Exceptional
4.7%
Ukrainians
96.1
/100
|
#118
Exceptional
4.7%
Immigrants | Morocco
95.7
/100
|
#119
Exceptional
4.7%
Macedonians
95.7
/100
|
#120
Exceptional
4.7%
Albanians
95.3
/100
|
#121
Exceptional
4.7%
Immigrants | Kazakhstan
95.1
/100
|
#122
Exceptional
4.7%
Finns
94.7
/100
|
#123
Exceptional
4.7%
Immigrants | Senegal
94.5
/100
|
#124
Exceptional
4.7%
Immigrants | Thailand
93.7
/100
|
#125
Exceptional
4.7%
Immigrants | South Central Asia
93.0
/100
|
#126
Exceptional
4.7%