Immigrants from Ghana vs Egyptian Unemployment Among Women with Children Under 6 years
COMPARE
Immigrants from Ghana
Egyptian
Unemployment Among Women with Children Under 6 years
Unemployment Among Women with Children Under 6 years Comparison
Immigrants from Ghana
Egyptians
8.3%
UNEMPLOYMENT AMONG WOMEN WITH CHILDREN UNDER 6 YEARS
0.5/ 100
METRIC RATING
258th/ 347
METRIC RANK
7.1%
UNEMPLOYMENT AMONG WOMEN WITH CHILDREN UNDER 6 YEARS
98.7/ 100
METRIC RATING
83rd/ 347
METRIC RANK
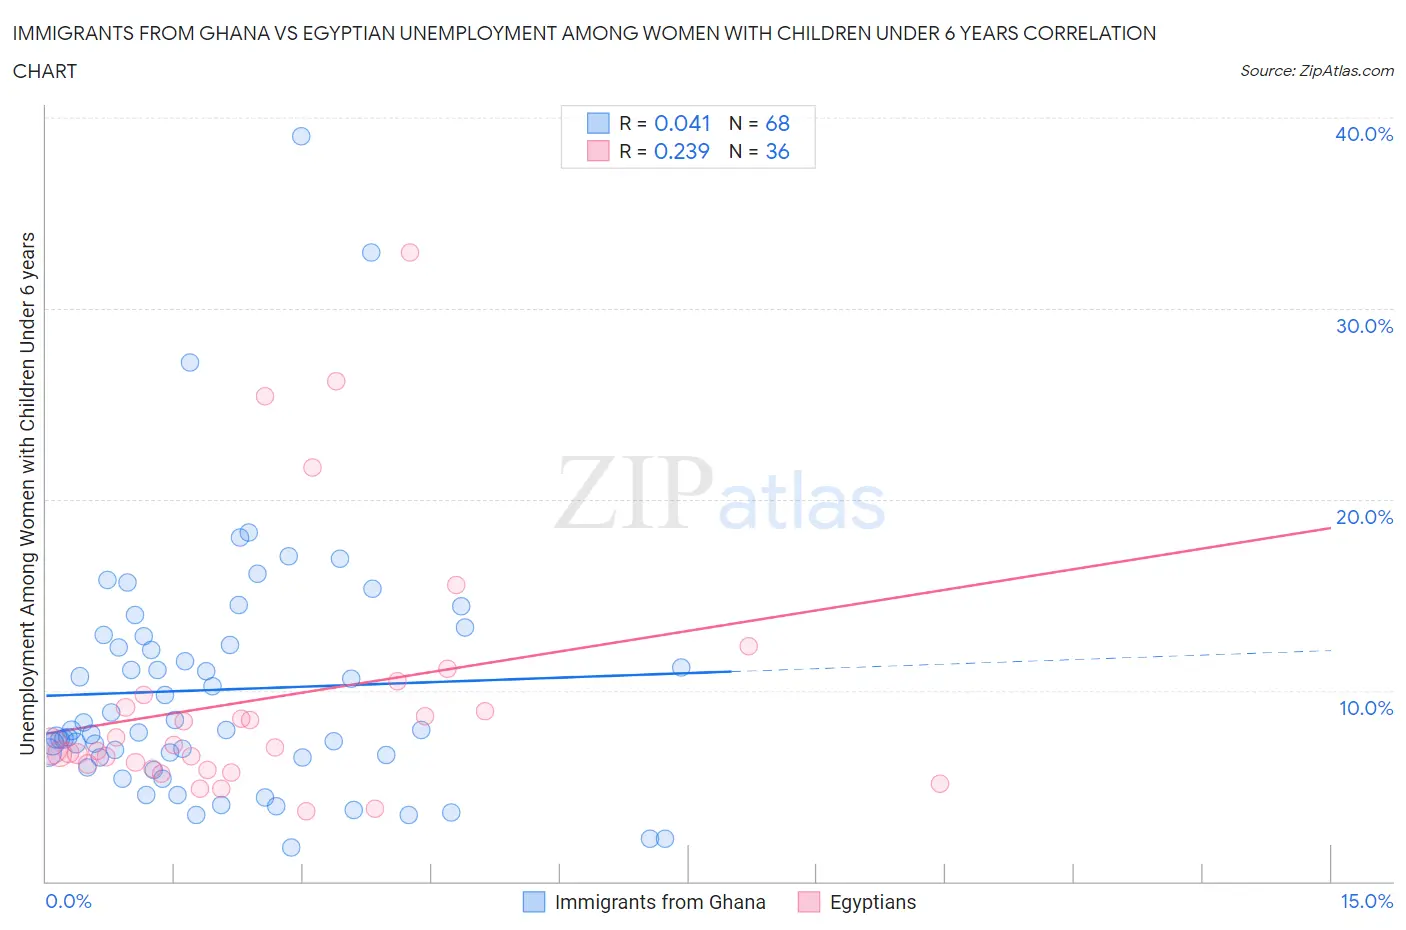
Immigrants from Ghana vs Egyptian Unemployment Among Women with Children Under 6 years Correlation Chart
The statistical analysis conducted on geographies consisting of 171,977,203 people shows no correlation between the proportion of Immigrants from Ghana and unemployment rate among women with children under the age of 6 in the United States with a correlation coefficient (R) of 0.041 and weighted average of 8.3%. Similarly, the statistical analysis conducted on geographies consisting of 225,958,031 people shows a weak positive correlation between the proportion of Egyptians and unemployment rate among women with children under the age of 6 in the United States with a correlation coefficient (R) of 0.239 and weighted average of 7.1%, a difference of 17.2%.
Unemployment Among Women with Children Under 6 years Correlation Summary
| Measurement | Immigrants from Ghana | Egyptian |
| Minimum | 1.8% | 3.7% |
| Maximum | 39.0% | 32.9% |
| Range | 37.2% | 29.2% |
| Mean | 10.0% | 9.5% |
| Median | 7.9% | 7.0% |
| Interquartile 25% (IQ1) | 6.5% | 6.0% |
| Interquartile 75% (IQ3) | 12.6% | 9.4% |
| Interquartile Range (IQR) | 6.1% | 3.4% |
| Standard Deviation (Sample) | 6.6% | 6.7% |
| Standard Deviation (Population) | 6.5% | 6.6% |
Similar Demographics by Unemployment Among Women with Children Under 6 years
Demographics Similar to Immigrants from Ghana by Unemployment Among Women with Children Under 6 years
In terms of unemployment among women with children under 6 years, the demographic groups most similar to Immigrants from Ghana are British West Indian (8.3%, a difference of 0.020%), Celtic (8.3%, a difference of 0.28%), Barbadian (8.3%, a difference of 0.29%), Immigrants from Portugal (8.3%, a difference of 0.30%), and White/Caucasian (8.4%, a difference of 0.55%).
| Demographics | Rating | Rank | Unemployment Among Women with Children Under 6 years |
| Guyanese | 1.0 /100 | #251 | Tragic 8.2% |
| Ghanaians | 1.0 /100 | #252 | Tragic 8.2% |
| Immigrants | Guyana | 0.8 /100 | #253 | Tragic 8.2% |
| Immigrants | Caribbean | 0.7 /100 | #254 | Tragic 8.3% |
| Immigrants | Portugal | 0.6 /100 | #255 | Tragic 8.3% |
| Celtics | 0.6 /100 | #256 | Tragic 8.3% |
| British West Indians | 0.5 /100 | #257 | Tragic 8.3% |
| Immigrants | Ghana | 0.5 /100 | #258 | Tragic 8.3% |
| Barbadians | 0.4 /100 | #259 | Tragic 8.3% |
| Whites/Caucasians | 0.3 /100 | #260 | Tragic 8.4% |
| Immigrants | Liberia | 0.3 /100 | #261 | Tragic 8.4% |
| West Indians | 0.3 /100 | #262 | Tragic 8.4% |
| Scotch-Irish | 0.3 /100 | #263 | Tragic 8.4% |
| Hondurans | 0.3 /100 | #264 | Tragic 8.4% |
| French Canadians | 0.3 /100 | #265 | Tragic 8.4% |
Demographics Similar to Egyptians by Unemployment Among Women with Children Under 6 years
In terms of unemployment among women with children under 6 years, the demographic groups most similar to Egyptians are Immigrants from Afghanistan (7.1%, a difference of 0.030%), Immigrants from Albania (7.1%, a difference of 0.050%), Immigrants from Romania (7.1%, a difference of 0.090%), Immigrants from Venezuela (7.1%, a difference of 0.18%), and Immigrants from Zimbabwe (7.1%, a difference of 0.21%).
| Demographics | Rating | Rank | Unemployment Among Women with Children Under 6 years |
| Estonians | 99.0 /100 | #76 | Exceptional 7.1% |
| Immigrants | Croatia | 98.9 /100 | #77 | Exceptional 7.1% |
| Immigrants | Somalia | 98.9 /100 | #78 | Exceptional 7.1% |
| Immigrants | Fiji | 98.9 /100 | #79 | Exceptional 7.1% |
| Immigrants | Greece | 98.9 /100 | #80 | Exceptional 7.1% |
| Immigrants | Venezuela | 98.8 /100 | #81 | Exceptional 7.1% |
| Immigrants | Afghanistan | 98.7 /100 | #82 | Exceptional 7.1% |
| Egyptians | 98.7 /100 | #83 | Exceptional 7.1% |
| Immigrants | Albania | 98.7 /100 | #84 | Exceptional 7.1% |
| Immigrants | Romania | 98.7 /100 | #85 | Exceptional 7.1% |
| Immigrants | Zimbabwe | 98.6 /100 | #86 | Exceptional 7.1% |
| Alsatians | 98.4 /100 | #87 | Exceptional 7.1% |
| Immigrants | Hungary | 98.3 /100 | #88 | Exceptional 7.1% |
| Immigrants | Denmark | 98.3 /100 | #89 | Exceptional 7.1% |
| Immigrants | Spain | 98.2 /100 | #90 | Exceptional 7.1% |