Immigrants from Israel vs Creek Unemployment Among Women with Children Under 6 years
COMPARE
Immigrants from Israel
Creek
Unemployment Among Women with Children Under 6 years
Unemployment Among Women with Children Under 6 years Comparison
Immigrants from Israel
Creek
6.5%
UNEMPLOYMENT AMONG WOMEN WITH CHILDREN UNDER 6 YEARS
100.0/ 100
METRIC RATING
28th/ 347
METRIC RANK
8.9%
UNEMPLOYMENT AMONG WOMEN WITH CHILDREN UNDER 6 YEARS
0.0/ 100
METRIC RATING
300th/ 347
METRIC RANK
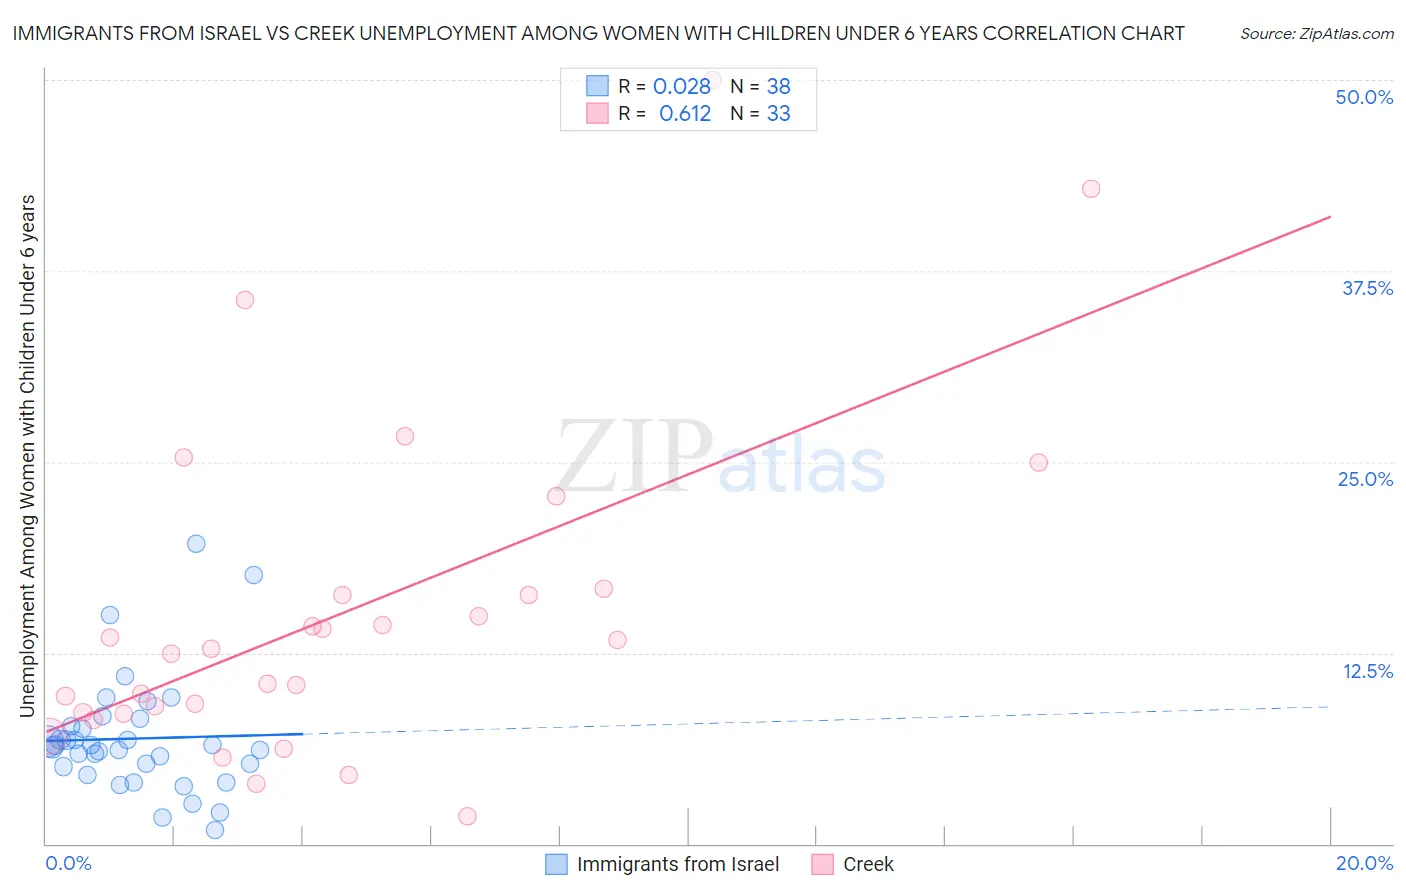
Immigrants from Israel vs Creek Unemployment Among Women with Children Under 6 years Correlation Chart
The statistical analysis conducted on geographies consisting of 175,300,948 people shows no correlation between the proportion of Immigrants from Israel and unemployment rate among women with children under the age of 6 in the United States with a correlation coefficient (R) of 0.028 and weighted average of 6.5%. Similarly, the statistical analysis conducted on geographies consisting of 152,329,999 people shows a significant positive correlation between the proportion of Creek and unemployment rate among women with children under the age of 6 in the United States with a correlation coefficient (R) of 0.612 and weighted average of 8.9%, a difference of 36.2%.
Unemployment Among Women with Children Under 6 years Correlation Summary
| Measurement | Immigrants from Israel | Creek |
| Minimum | 0.90% | 1.8% |
| Maximum | 19.6% | 50.0% |
| Range | 18.7% | 48.2% |
| Mean | 6.9% | 15.1% |
| Median | 6.4% | 12.8% |
| Interquartile 25% (IQ1) | 5.0% | 8.5% |
| Interquartile 75% (IQ3) | 7.7% | 16.5% |
| Interquartile Range (IQR) | 2.6% | 8.0% |
| Standard Deviation (Sample) | 3.8% | 10.9% |
| Standard Deviation (Population) | 3.8% | 10.7% |
Similar Demographics by Unemployment Among Women with Children Under 6 years
Demographics Similar to Immigrants from Israel by Unemployment Among Women with Children Under 6 years
In terms of unemployment among women with children under 6 years, the demographic groups most similar to Immigrants from Israel are Immigrants from Japan (6.5%, a difference of 0.020%), Cypriot (6.5%, a difference of 0.12%), Soviet Union (6.5%, a difference of 0.20%), Laotian (6.5%, a difference of 0.22%), and Immigrants from Sweden (6.6%, a difference of 0.26%).
| Demographics | Rating | Rank | Unemployment Among Women with Children Under 6 years |
| Burmese | 100.0 /100 | #21 | Exceptional 6.5% |
| Immigrants | Korea | 100.0 /100 | #22 | Exceptional 6.5% |
| Bulgarians | 100.0 /100 | #23 | Exceptional 6.5% |
| Laotians | 100.0 /100 | #24 | Exceptional 6.5% |
| Soviet Union | 100.0 /100 | #25 | Exceptional 6.5% |
| Cypriots | 100.0 /100 | #26 | Exceptional 6.5% |
| Immigrants | Japan | 100.0 /100 | #27 | Exceptional 6.5% |
| Immigrants | Israel | 100.0 /100 | #28 | Exceptional 6.5% |
| Immigrants | Sweden | 100.0 /100 | #29 | Exceptional 6.6% |
| Immigrants | Belarus | 100.0 /100 | #30 | Exceptional 6.6% |
| Immigrants | Moldova | 100.0 /100 | #31 | Exceptional 6.6% |
| Tsimshian | 100.0 /100 | #32 | Exceptional 6.6% |
| Immigrants | Vietnam | 100.0 /100 | #33 | Exceptional 6.6% |
| Immigrants | South Central Asia | 100.0 /100 | #34 | Exceptional 6.6% |
| Yakama | 100.0 /100 | #35 | Exceptional 6.6% |
Demographics Similar to Creek by Unemployment Among Women with Children Under 6 years
In terms of unemployment among women with children under 6 years, the demographic groups most similar to Creek are Immigrants from Jamaica (8.9%, a difference of 0.090%), Tlingit-Haida (8.9%, a difference of 0.30%), Mexican (8.9%, a difference of 0.46%), Chickasaw (9.0%, a difference of 0.53%), and Immigrants from Dominican Republic (8.9%, a difference of 0.55%).
| Demographics | Rating | Rank | Unemployment Among Women with Children Under 6 years |
| Immigrants | Bangladesh | 0.0 /100 | #293 | Tragic 8.8% |
| Immigrants | Nonimmigrants | 0.0 /100 | #294 | Tragic 8.8% |
| Immigrants | Central America | 0.0 /100 | #295 | Tragic 8.9% |
| Immigrants | Dominican Republic | 0.0 /100 | #296 | Tragic 8.9% |
| Mexicans | 0.0 /100 | #297 | Tragic 8.9% |
| Tlingit-Haida | 0.0 /100 | #298 | Tragic 8.9% |
| Immigrants | Jamaica | 0.0 /100 | #299 | Tragic 8.9% |
| Creek | 0.0 /100 | #300 | Tragic 8.9% |
| Chickasaw | 0.0 /100 | #301 | Tragic 9.0% |
| Hispanics or Latinos | 0.0 /100 | #302 | Tragic 9.0% |
| Immigrants | West Indies | 0.0 /100 | #303 | Tragic 9.0% |
| Immigrants | Mexico | 0.0 /100 | #304 | Tragic 9.1% |
| Alaskan Athabascans | 0.0 /100 | #305 | Tragic 9.1% |
| Pueblo | 0.0 /100 | #306 | Tragic 9.1% |
| Dominicans | 0.0 /100 | #307 | Tragic 9.1% |