Carpatho Rusyn vs South American Indian Unemployment Among Ages 35 to 44 years
COMPARE
Carpatho Rusyn
South American Indian
Unemployment Among Ages 35 to 44 years
Unemployment Among Ages 35 to 44 years Comparison
Carpatho Rusyns
South American Indians
4.3%
UNEMPLOYMENT AMONG AGES 35 TO 44 YEARS
99.2/ 100
METRIC RATING
31st/ 347
METRIC RANK
4.7%
UNEMPLOYMENT AMONG AGES 35 TO 44 YEARS
40.7/ 100
METRIC RATING
178th/ 347
METRIC RANK
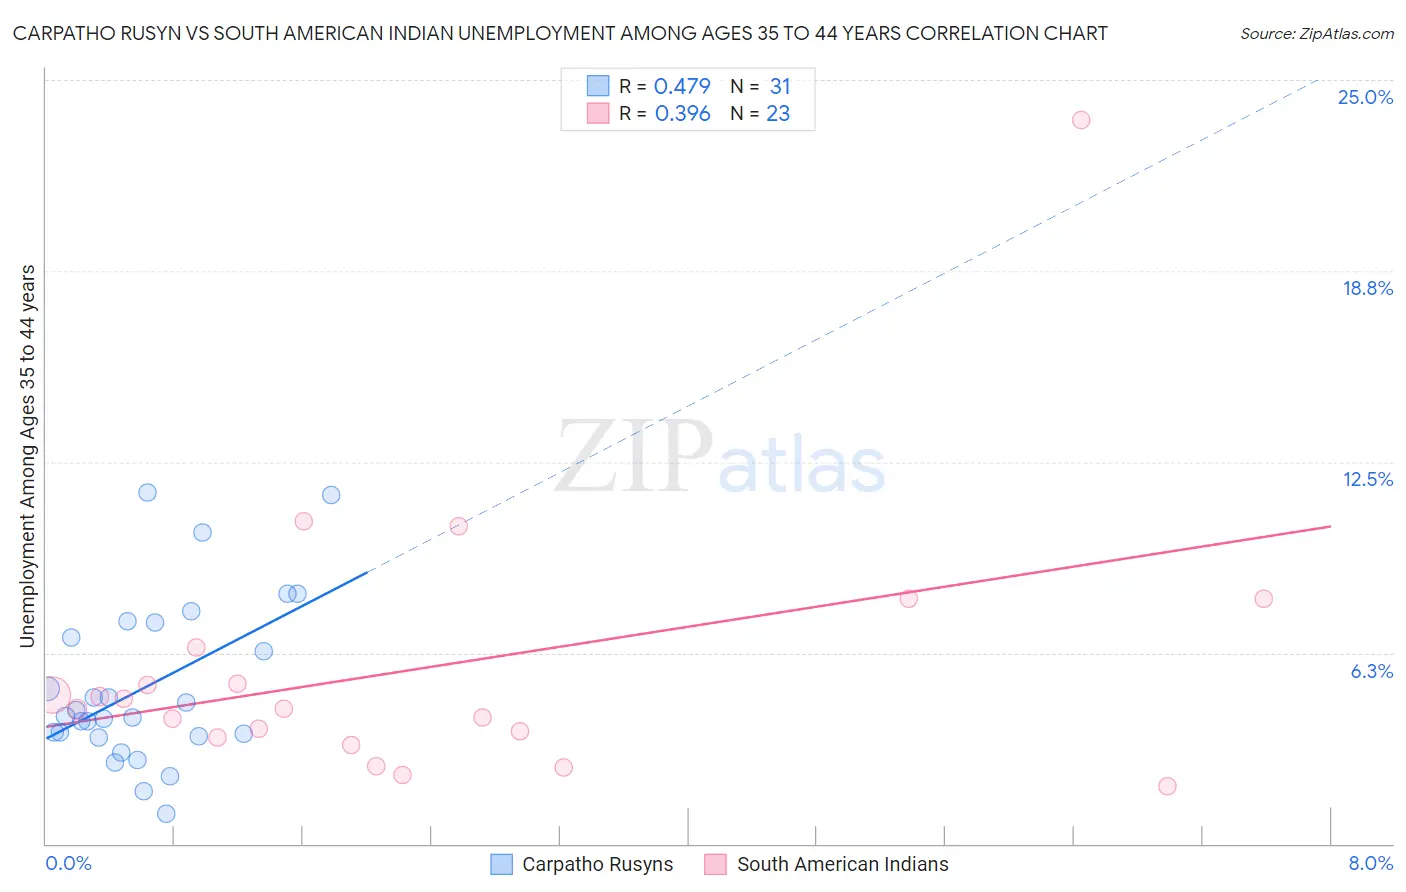
Carpatho Rusyn vs South American Indian Unemployment Among Ages 35 to 44 years Correlation Chart
The statistical analysis conducted on geographies consisting of 58,444,896 people shows a moderate positive correlation between the proportion of Carpatho Rusyns and unemployment rate among population between the ages 35 and 44 in the United States with a correlation coefficient (R) of 0.479 and weighted average of 4.3%. Similarly, the statistical analysis conducted on geographies consisting of 163,456,599 people shows a mild positive correlation between the proportion of South American Indians and unemployment rate among population between the ages 35 and 44 in the United States with a correlation coefficient (R) of 0.396 and weighted average of 4.7%, a difference of 10.0%.
Unemployment Among Ages 35 to 44 years Correlation Summary
| Measurement | Carpatho Rusyn | South American Indian |
| Minimum | 1.0% | 1.9% |
| Maximum | 11.5% | 23.7% |
| Range | 10.5% | 21.8% |
| Mean | 5.2% | 5.8% |
| Median | 4.2% | 4.4% |
| Interquartile 25% (IQ1) | 3.5% | 3.5% |
| Interquartile 75% (IQ3) | 7.2% | 6.4% |
| Interquartile Range (IQR) | 3.7% | 2.9% |
| Standard Deviation (Sample) | 2.7% | 4.6% |
| Standard Deviation (Population) | 2.6% | 4.5% |
Similar Demographics by Unemployment Among Ages 35 to 44 years
Demographics Similar to Carpatho Rusyns by Unemployment Among Ages 35 to 44 years
In terms of unemployment among ages 35 to 44 years, the demographic groups most similar to Carpatho Rusyns are Immigrants from Pakistan (4.3%, a difference of 0.040%), Chinese (4.3%, a difference of 0.10%), European (4.3%, a difference of 0.11%), Immigrants from Sri Lanka (4.3%, a difference of 0.20%), and Immigrants from Japan (4.3%, a difference of 0.30%).
| Demographics | Rating | Rank | Unemployment Among Ages 35 to 44 years |
| Tlingit-Haida | 99.5 /100 | #24 | Exceptional 4.3% |
| Bulgarians | 99.3 /100 | #25 | Exceptional 4.3% |
| Turks | 99.3 /100 | #26 | Exceptional 4.3% |
| Assyrians/Chaldeans/Syriacs | 99.3 /100 | #27 | Exceptional 4.3% |
| Immigrants | Japan | 99.3 /100 | #28 | Exceptional 4.3% |
| Europeans | 99.2 /100 | #29 | Exceptional 4.3% |
| Immigrants | Pakistan | 99.2 /100 | #30 | Exceptional 4.3% |
| Carpatho Rusyns | 99.2 /100 | #31 | Exceptional 4.3% |
| Chinese | 99.1 /100 | #32 | Exceptional 4.3% |
| Immigrants | Sri Lanka | 99.1 /100 | #33 | Exceptional 4.3% |
| Jordanians | 99.0 /100 | #34 | Exceptional 4.3% |
| Luxembourgers | 99.0 /100 | #35 | Exceptional 4.3% |
| Mongolians | 98.9 /100 | #36 | Exceptional 4.3% |
| Immigrants | Zimbabwe | 98.9 /100 | #37 | Exceptional 4.3% |
| Burmese | 98.9 /100 | #38 | Exceptional 4.3% |
Demographics Similar to South American Indians by Unemployment Among Ages 35 to 44 years
In terms of unemployment among ages 35 to 44 years, the demographic groups most similar to South American Indians are Immigrants from South Eastern Asia (4.7%, a difference of 0.040%), Immigrants from Peru (4.7%, a difference of 0.060%), Brazilian (4.7%, a difference of 0.080%), Israeli (4.7%, a difference of 0.16%), and Immigrants from Poland (4.7%, a difference of 0.21%).
| Demographics | Rating | Rank | Unemployment Among Ages 35 to 44 years |
| Indonesians | 51.7 /100 | #171 | Average 4.7% |
| Lebanese | 51.4 /100 | #172 | Average 4.7% |
| Iraqis | 50.9 /100 | #173 | Average 4.7% |
| Afghans | 50.0 /100 | #174 | Average 4.7% |
| Immigrants | Germany | 48.9 /100 | #175 | Average 4.7% |
| Immigrants | Uganda | 48.1 /100 | #176 | Average 4.7% |
| Slovaks | 44.6 /100 | #177 | Average 4.7% |
| South American Indians | 40.7 /100 | #178 | Average 4.7% |
| Immigrants | South Eastern Asia | 40.2 /100 | #179 | Average 4.7% |
| Immigrants | Peru | 39.9 /100 | #180 | Fair 4.7% |
| Brazilians | 39.5 /100 | #181 | Fair 4.7% |
| Israelis | 38.5 /100 | #182 | Fair 4.7% |
| Immigrants | Poland | 37.9 /100 | #183 | Fair 4.7% |
| Immigrants | Zaire | 37.3 /100 | #184 | Fair 4.7% |
| Immigrants | Costa Rica | 37.0 /100 | #185 | Fair 4.7% |