Carpatho Rusyn vs Mexican Unemployment Among Ages 35 to 44 years
COMPARE
Carpatho Rusyn
Mexican
Unemployment Among Ages 35 to 44 years
Unemployment Among Ages 35 to 44 years Comparison
Carpatho Rusyns
Mexicans
4.3%
UNEMPLOYMENT AMONG AGES 35 TO 44 YEARS
99.2/ 100
METRIC RATING
31st/ 347
METRIC RANK
5.3%
UNEMPLOYMENT AMONG AGES 35 TO 44 YEARS
0.1/ 100
METRIC RATING
259th/ 347
METRIC RANK
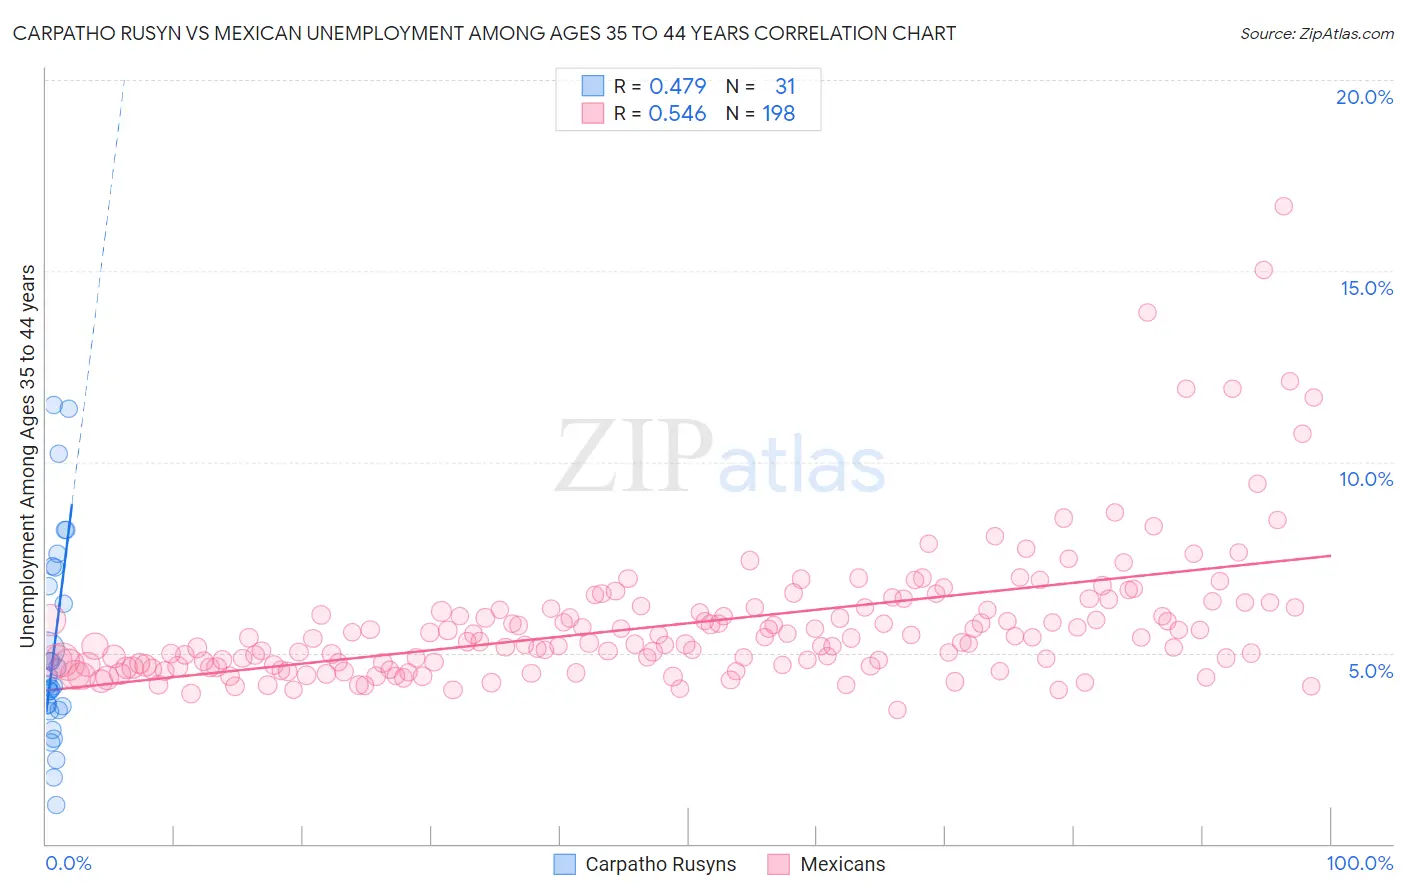
Carpatho Rusyn vs Mexican Unemployment Among Ages 35 to 44 years Correlation Chart
The statistical analysis conducted on geographies consisting of 58,444,896 people shows a moderate positive correlation between the proportion of Carpatho Rusyns and unemployment rate among population between the ages 35 and 44 in the United States with a correlation coefficient (R) of 0.479 and weighted average of 4.3%. Similarly, the statistical analysis conducted on geographies consisting of 530,210,918 people shows a substantial positive correlation between the proportion of Mexicans and unemployment rate among population between the ages 35 and 44 in the United States with a correlation coefficient (R) of 0.546 and weighted average of 5.3%, a difference of 22.7%.
Unemployment Among Ages 35 to 44 years Correlation Summary
| Measurement | Carpatho Rusyn | Mexican |
| Minimum | 1.0% | 3.5% |
| Maximum | 11.5% | 16.7% |
| Range | 10.5% | 13.2% |
| Mean | 5.2% | 5.8% |
| Median | 4.2% | 5.3% |
| Interquartile 25% (IQ1) | 3.5% | 4.7% |
| Interquartile 75% (IQ3) | 7.2% | 6.2% |
| Interquartile Range (IQR) | 3.7% | 1.5% |
| Standard Deviation (Sample) | 2.7% | 1.9% |
| Standard Deviation (Population) | 2.6% | 1.8% |
Similar Demographics by Unemployment Among Ages 35 to 44 years
Demographics Similar to Carpatho Rusyns by Unemployment Among Ages 35 to 44 years
In terms of unemployment among ages 35 to 44 years, the demographic groups most similar to Carpatho Rusyns are Immigrants from Pakistan (4.3%, a difference of 0.040%), Chinese (4.3%, a difference of 0.10%), European (4.3%, a difference of 0.11%), Immigrants from Sri Lanka (4.3%, a difference of 0.20%), and Immigrants from Japan (4.3%, a difference of 0.30%).
| Demographics | Rating | Rank | Unemployment Among Ages 35 to 44 years |
| Tlingit-Haida | 99.5 /100 | #24 | Exceptional 4.3% |
| Bulgarians | 99.3 /100 | #25 | Exceptional 4.3% |
| Turks | 99.3 /100 | #26 | Exceptional 4.3% |
| Assyrians/Chaldeans/Syriacs | 99.3 /100 | #27 | Exceptional 4.3% |
| Immigrants | Japan | 99.3 /100 | #28 | Exceptional 4.3% |
| Europeans | 99.2 /100 | #29 | Exceptional 4.3% |
| Immigrants | Pakistan | 99.2 /100 | #30 | Exceptional 4.3% |
| Carpatho Rusyns | 99.2 /100 | #31 | Exceptional 4.3% |
| Chinese | 99.1 /100 | #32 | Exceptional 4.3% |
| Immigrants | Sri Lanka | 99.1 /100 | #33 | Exceptional 4.3% |
| Jordanians | 99.0 /100 | #34 | Exceptional 4.3% |
| Luxembourgers | 99.0 /100 | #35 | Exceptional 4.3% |
| Mongolians | 98.9 /100 | #36 | Exceptional 4.3% |
| Immigrants | Zimbabwe | 98.9 /100 | #37 | Exceptional 4.3% |
| Burmese | 98.9 /100 | #38 | Exceptional 4.3% |
Demographics Similar to Mexicans by Unemployment Among Ages 35 to 44 years
In terms of unemployment among ages 35 to 44 years, the demographic groups most similar to Mexicans are Subsaharan African (5.3%, a difference of 0.030%), Immigrants from Latin America (5.3%, a difference of 0.090%), Immigrants from Fiji (5.3%, a difference of 0.21%), Spanish American (5.3%, a difference of 0.23%), and Seminole (5.2%, a difference of 0.50%).
| Demographics | Rating | Rank | Unemployment Among Ages 35 to 44 years |
| Armenians | 0.2 /100 | #252 | Tragic 5.2% |
| Mexican American Indians | 0.2 /100 | #253 | Tragic 5.2% |
| Immigrants | Bahamas | 0.2 /100 | #254 | Tragic 5.2% |
| Cherokee | 0.2 /100 | #255 | Tragic 5.2% |
| Seminole | 0.1 /100 | #256 | Tragic 5.2% |
| Immigrants | Fiji | 0.1 /100 | #257 | Tragic 5.3% |
| Immigrants | Latin America | 0.1 /100 | #258 | Tragic 5.3% |
| Mexicans | 0.1 /100 | #259 | Tragic 5.3% |
| Sub-Saharan Africans | 0.1 /100 | #260 | Tragic 5.3% |
| Spanish Americans | 0.1 /100 | #261 | Tragic 5.3% |
| Immigrants | Central America | 0.1 /100 | #262 | Tragic 5.3% |
| Choctaw | 0.1 /100 | #263 | Tragic 5.3% |
| Ghanaians | 0.1 /100 | #264 | Tragic 5.3% |
| Yaqui | 0.1 /100 | #265 | Tragic 5.3% |
| Immigrants | Bangladesh | 0.1 /100 | #266 | Tragic 5.3% |