Carpatho Rusyn vs Korean Unemployment Among Ages 35 to 44 years
COMPARE
Carpatho Rusyn
Korean
Unemployment Among Ages 35 to 44 years
Unemployment Among Ages 35 to 44 years Comparison
Carpatho Rusyns
Koreans
4.3%
UNEMPLOYMENT AMONG AGES 35 TO 44 YEARS
99.2/ 100
METRIC RATING
31st/ 347
METRIC RANK
4.8%
UNEMPLOYMENT AMONG AGES 35 TO 44 YEARS
28.1/ 100
METRIC RATING
194th/ 347
METRIC RANK
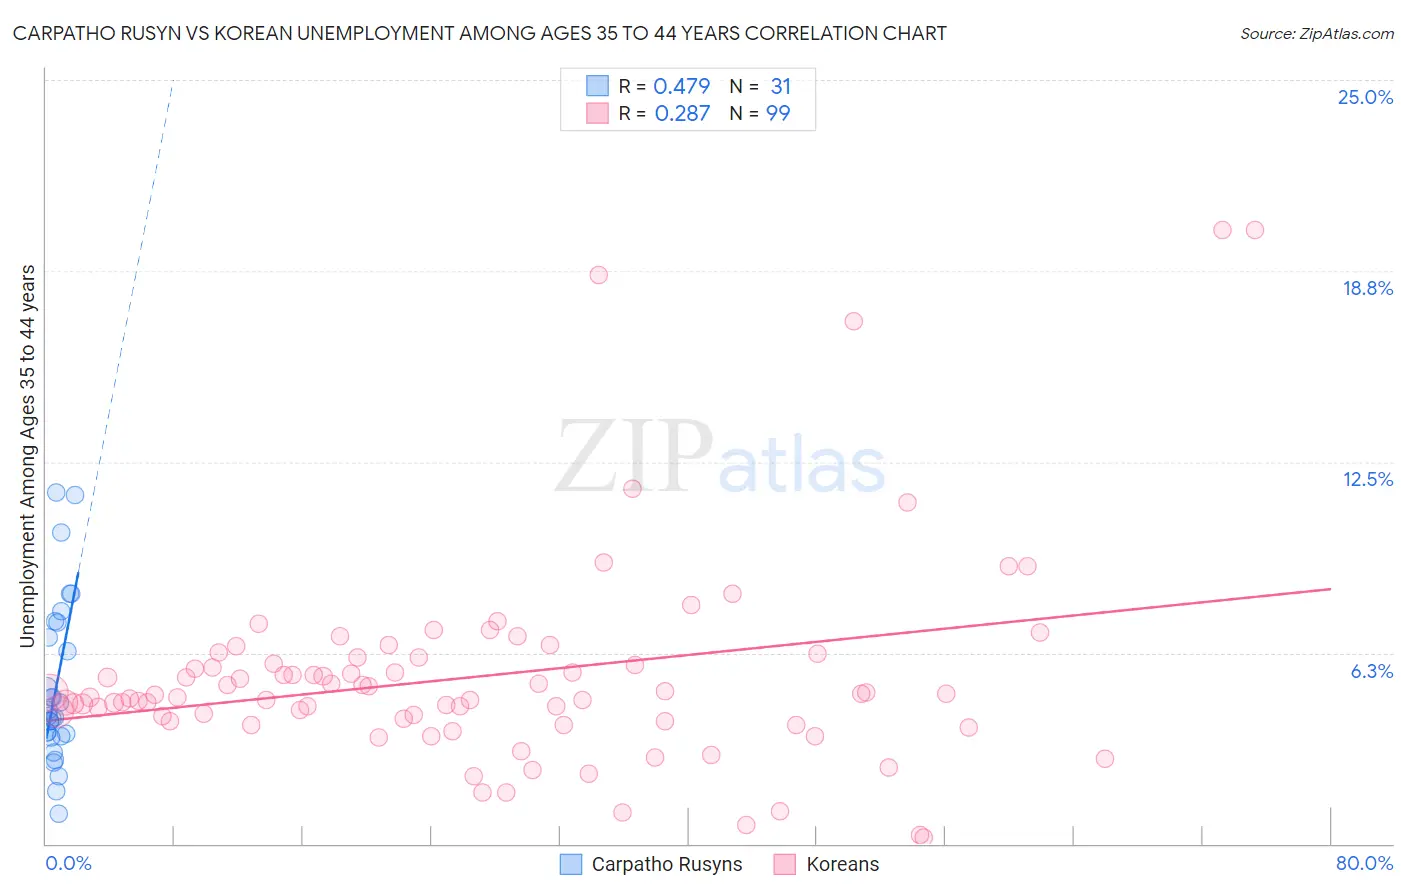
Carpatho Rusyn vs Korean Unemployment Among Ages 35 to 44 years Correlation Chart
The statistical analysis conducted on geographies consisting of 58,444,896 people shows a moderate positive correlation between the proportion of Carpatho Rusyns and unemployment rate among population between the ages 35 and 44 in the United States with a correlation coefficient (R) of 0.479 and weighted average of 4.3%. Similarly, the statistical analysis conducted on geographies consisting of 490,991,117 people shows a weak positive correlation between the proportion of Koreans and unemployment rate among population between the ages 35 and 44 in the United States with a correlation coefficient (R) of 0.287 and weighted average of 4.8%, a difference of 11.1%.
Unemployment Among Ages 35 to 44 years Correlation Summary
| Measurement | Carpatho Rusyn | Korean |
| Minimum | 1.0% | 0.20% |
| Maximum | 11.5% | 20.1% |
| Range | 10.5% | 19.9% |
| Mean | 5.2% | 5.5% |
| Median | 4.2% | 4.9% |
| Interquartile 25% (IQ1) | 3.5% | 4.0% |
| Interquartile 75% (IQ3) | 7.2% | 6.1% |
| Interquartile Range (IQR) | 3.7% | 2.1% |
| Standard Deviation (Sample) | 2.7% | 3.4% |
| Standard Deviation (Population) | 2.6% | 3.4% |
Similar Demographics by Unemployment Among Ages 35 to 44 years
Demographics Similar to Carpatho Rusyns by Unemployment Among Ages 35 to 44 years
In terms of unemployment among ages 35 to 44 years, the demographic groups most similar to Carpatho Rusyns are Immigrants from Pakistan (4.3%, a difference of 0.040%), Chinese (4.3%, a difference of 0.10%), European (4.3%, a difference of 0.11%), Immigrants from Sri Lanka (4.3%, a difference of 0.20%), and Immigrants from Japan (4.3%, a difference of 0.30%).
| Demographics | Rating | Rank | Unemployment Among Ages 35 to 44 years |
| Tlingit-Haida | 99.5 /100 | #24 | Exceptional 4.3% |
| Bulgarians | 99.3 /100 | #25 | Exceptional 4.3% |
| Turks | 99.3 /100 | #26 | Exceptional 4.3% |
| Assyrians/Chaldeans/Syriacs | 99.3 /100 | #27 | Exceptional 4.3% |
| Immigrants | Japan | 99.3 /100 | #28 | Exceptional 4.3% |
| Europeans | 99.2 /100 | #29 | Exceptional 4.3% |
| Immigrants | Pakistan | 99.2 /100 | #30 | Exceptional 4.3% |
| Carpatho Rusyns | 99.2 /100 | #31 | Exceptional 4.3% |
| Chinese | 99.1 /100 | #32 | Exceptional 4.3% |
| Immigrants | Sri Lanka | 99.1 /100 | #33 | Exceptional 4.3% |
| Jordanians | 99.0 /100 | #34 | Exceptional 4.3% |
| Luxembourgers | 99.0 /100 | #35 | Exceptional 4.3% |
| Mongolians | 98.9 /100 | #36 | Exceptional 4.3% |
| Immigrants | Zimbabwe | 98.9 /100 | #37 | Exceptional 4.3% |
| Burmese | 98.9 /100 | #38 | Exceptional 4.3% |
Demographics Similar to Koreans by Unemployment Among Ages 35 to 44 years
In terms of unemployment among ages 35 to 44 years, the demographic groups most similar to Koreans are Bangladeshi (4.8%, a difference of 0.010%), Immigrants from Albania (4.8%, a difference of 0.20%), Spanish (4.8%, a difference of 0.20%), Immigrants from Syria (4.8%, a difference of 0.40%), and Immigrants from Oceania (4.8%, a difference of 0.45%).
| Demographics | Rating | Rank | Unemployment Among Ages 35 to 44 years |
| Malaysians | 35.5 /100 | #187 | Fair 4.7% |
| Immigrants | Laos | 34.5 /100 | #188 | Fair 4.7% |
| Immigrants | Congo | 33.9 /100 | #189 | Fair 4.7% |
| Immigrants | Southern Europe | 33.8 /100 | #190 | Fair 4.7% |
| Immigrants | South America | 33.8 /100 | #191 | Fair 4.7% |
| Immigrants | Albania | 30.5 /100 | #192 | Fair 4.8% |
| Spanish | 30.4 /100 | #193 | Fair 4.8% |
| Koreans | 28.1 /100 | #194 | Fair 4.8% |
| Bangladeshis | 28.0 /100 | #195 | Fair 4.8% |
| Immigrants | Syria | 23.6 /100 | #196 | Fair 4.8% |
| Immigrants | Oceania | 23.2 /100 | #197 | Fair 4.8% |
| Immigrants | Thailand | 22.9 /100 | #198 | Fair 4.8% |
| Immigrants | Middle Africa | 21.9 /100 | #199 | Fair 4.8% |
| Immigrants | Ukraine | 21.4 /100 | #200 | Fair 4.8% |
| Ugandans | 21.4 /100 | #201 | Fair 4.8% |