Carpatho Rusyn vs Czech Unemployment Among Ages 35 to 44 years
COMPARE
Carpatho Rusyn
Czech
Unemployment Among Ages 35 to 44 years
Unemployment Among Ages 35 to 44 years Comparison
Carpatho Rusyns
Czechs
4.3%
UNEMPLOYMENT AMONG AGES 35 TO 44 YEARS
99.2/ 100
METRIC RATING
31st/ 347
METRIC RANK
4.1%
UNEMPLOYMENT AMONG AGES 35 TO 44 YEARS
99.9/ 100
METRIC RATING
14th/ 347
METRIC RANK
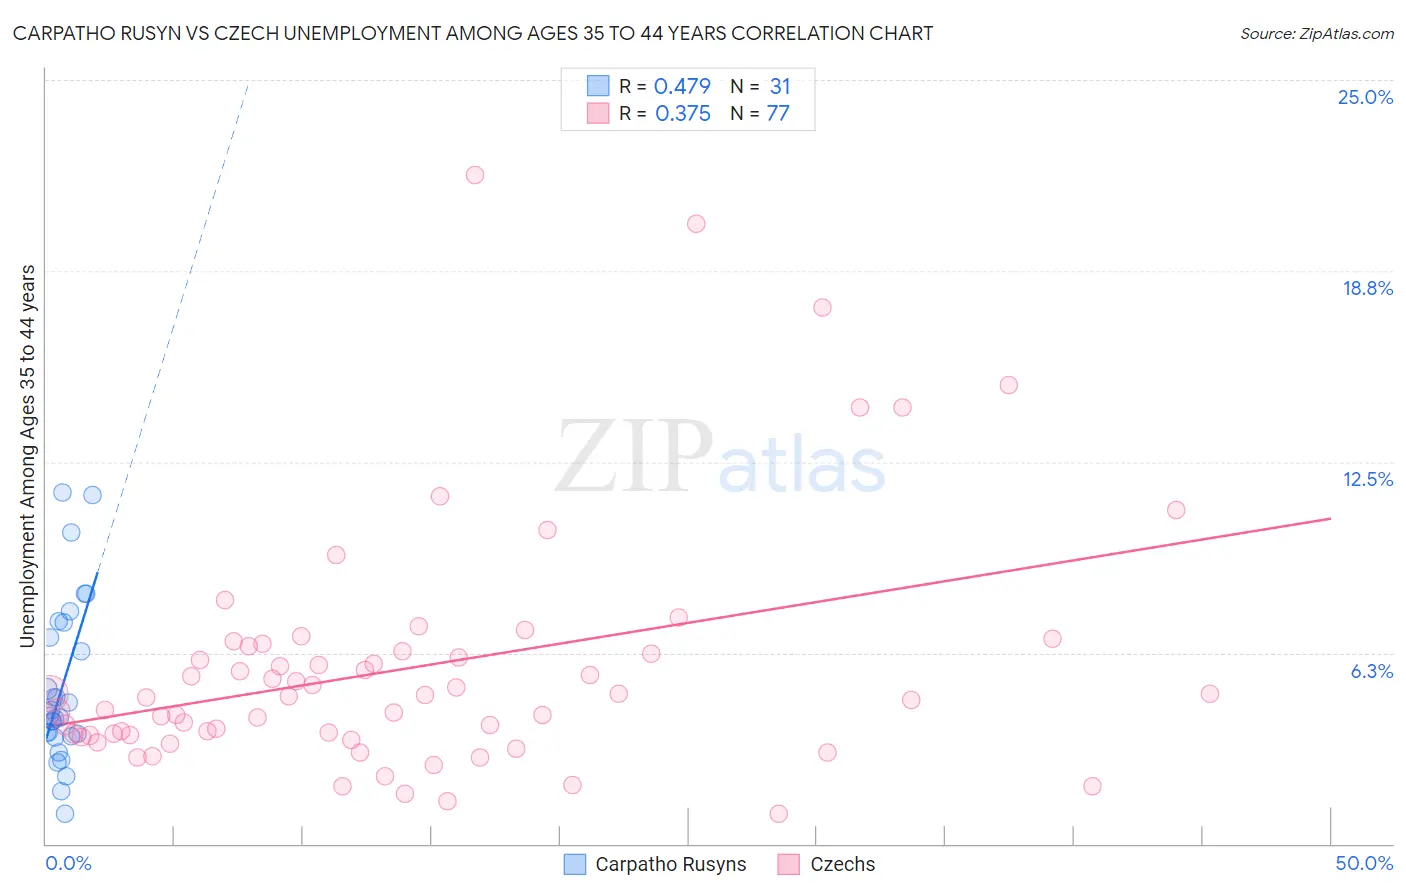
Carpatho Rusyn vs Czech Unemployment Among Ages 35 to 44 years Correlation Chart
The statistical analysis conducted on geographies consisting of 58,444,896 people shows a moderate positive correlation between the proportion of Carpatho Rusyns and unemployment rate among population between the ages 35 and 44 in the United States with a correlation coefficient (R) of 0.479 and weighted average of 4.3%. Similarly, the statistical analysis conducted on geographies consisting of 462,421,231 people shows a mild positive correlation between the proportion of Czechs and unemployment rate among population between the ages 35 and 44 in the United States with a correlation coefficient (R) of 0.375 and weighted average of 4.1%, a difference of 3.5%.
Unemployment Among Ages 35 to 44 years Correlation Summary
| Measurement | Carpatho Rusyn | Czech |
| Minimum | 1.0% | 1.0% |
| Maximum | 11.5% | 21.9% |
| Range | 10.5% | 20.9% |
| Mean | 5.2% | 5.8% |
| Median | 4.2% | 4.8% |
| Interquartile 25% (IQ1) | 3.5% | 3.6% |
| Interquartile 75% (IQ3) | 7.2% | 6.4% |
| Interquartile Range (IQR) | 3.7% | 2.8% |
| Standard Deviation (Sample) | 2.7% | 4.0% |
| Standard Deviation (Population) | 2.6% | 4.0% |
Demographics Similar to Carpatho Rusyns and Czechs by Unemployment Among Ages 35 to 44 years
In terms of unemployment among ages 35 to 44 years, the demographic groups most similar to Carpatho Rusyns are Immigrants from Pakistan (4.3%, a difference of 0.040%), Chinese (4.3%, a difference of 0.10%), European (4.3%, a difference of 0.11%), Immigrants from Japan (4.3%, a difference of 0.30%), and Assyrian/Chaldean/Syriac (4.3%, a difference of 0.38%). Similarly, the demographic groups most similar to Czechs are Tongan (4.2%, a difference of 0.080%), Bolivian (4.1%, a difference of 0.10%), Venezuelan (4.1%, a difference of 0.14%), Cuban (4.2%, a difference of 0.85%), and Swedish (4.2%, a difference of 0.86%).
| Demographics | Rating | Rank | Unemployment Among Ages 35 to 44 years |
| Venezuelans | 99.9 /100 | #12 | Exceptional 4.1% |
| Bolivians | 99.9 /100 | #13 | Exceptional 4.1% |
| Czechs | 99.9 /100 | #14 | Exceptional 4.1% |
| Tongans | 99.8 /100 | #15 | Exceptional 4.2% |
| Cubans | 99.8 /100 | #16 | Exceptional 4.2% |
| Swedes | 99.8 /100 | #17 | Exceptional 4.2% |
| Latvians | 99.8 /100 | #18 | Exceptional 4.2% |
| Immigrants | Nepal | 99.7 /100 | #19 | Exceptional 4.2% |
| Immigrants | Bolivia | 99.7 /100 | #20 | Exceptional 4.2% |
| Paraguayans | 99.6 /100 | #21 | Exceptional 4.2% |
| Scandinavians | 99.5 /100 | #22 | Exceptional 4.2% |
| Immigrants | Kuwait | 99.5 /100 | #23 | Exceptional 4.3% |
| Tlingit-Haida | 99.5 /100 | #24 | Exceptional 4.3% |
| Bulgarians | 99.3 /100 | #25 | Exceptional 4.3% |
| Turks | 99.3 /100 | #26 | Exceptional 4.3% |
| Assyrians/Chaldeans/Syriacs | 99.3 /100 | #27 | Exceptional 4.3% |
| Immigrants | Japan | 99.3 /100 | #28 | Exceptional 4.3% |
| Europeans | 99.2 /100 | #29 | Exceptional 4.3% |
| Immigrants | Pakistan | 99.2 /100 | #30 | Exceptional 4.3% |
| Carpatho Rusyns | 99.2 /100 | #31 | Exceptional 4.3% |
| Chinese | 99.1 /100 | #32 | Exceptional 4.3% |