Carpatho Rusyn vs Dominican Unemployment Among Women with Children Ages 6 to 17 years
COMPARE
Carpatho Rusyn
Dominican
Unemployment Among Women with Children Ages 6 to 17 years
Unemployment Among Women with Children Ages 6 to 17 years Comparison
Carpatho Rusyns
Dominicans
10.0%
UNEMPLOYMENT AMONG WOMEN WITH CHILDREN AGES 6 TO 17 YEARS
0.0/ 100
METRIC RATING
292nd/ 347
METRIC RANK
10.8%
UNEMPLOYMENT AMONG WOMEN WITH CHILDREN AGES 6 TO 17 YEARS
0.0/ 100
METRIC RATING
323rd/ 347
METRIC RANK
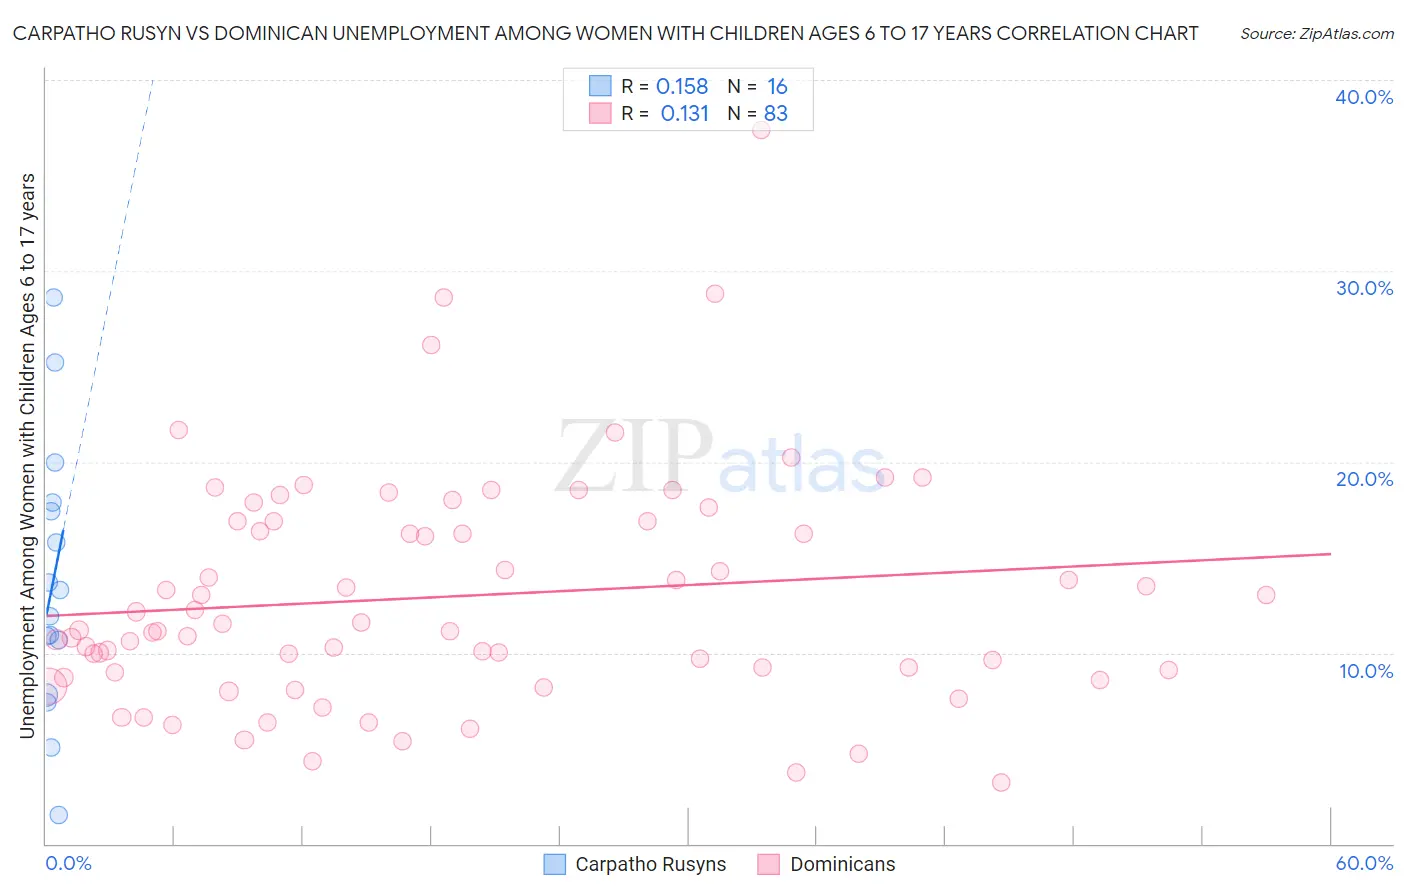
Carpatho Rusyn vs Dominican Unemployment Among Women with Children Ages 6 to 17 years Correlation Chart
The statistical analysis conducted on geographies consisting of 51,221,084 people shows a poor positive correlation between the proportion of Carpatho Rusyns and unemployment rate among women with children between the ages 6 and 17 in the United States with a correlation coefficient (R) of 0.158 and weighted average of 10.0%. Similarly, the statistical analysis conducted on geographies consisting of 262,781,986 people shows a poor positive correlation between the proportion of Dominicans and unemployment rate among women with children between the ages 6 and 17 in the United States with a correlation coefficient (R) of 0.131 and weighted average of 10.8%, a difference of 8.1%.
Unemployment Among Women with Children Ages 6 to 17 years Correlation Summary
| Measurement | Carpatho Rusyn | Dominican |
| Minimum | 1.5% | 3.2% |
| Maximum | 28.6% | 37.4% |
| Range | 27.1% | 34.2% |
| Mean | 13.6% | 13.0% |
| Median | 12.6% | 11.2% |
| Interquartile 25% (IQ1) | 9.2% | 9.0% |
| Interquartile 75% (IQ3) | 17.6% | 16.9% |
| Interquartile Range (IQR) | 8.4% | 7.9% |
| Standard Deviation (Sample) | 7.1% | 6.1% |
| Standard Deviation (Population) | 6.9% | 6.0% |
Similar Demographics by Unemployment Among Women with Children Ages 6 to 17 years
Demographics Similar to Carpatho Rusyns by Unemployment Among Women with Children Ages 6 to 17 years
In terms of unemployment among women with children ages 6 to 17 years, the demographic groups most similar to Carpatho Rusyns are Nonimmigrants (10.0%, a difference of 0.010%), Subsaharan African (10.0%, a difference of 0.030%), Honduran (10.0%, a difference of 0.050%), Haitian (10.0%, a difference of 0.090%), and Ecuadorian (10.0%, a difference of 0.18%).
| Demographics | Rating | Rank | Unemployment Among Women with Children Ages 6 to 17 years |
| Hispanics or Latinos | 0.0 /100 | #285 | Tragic 9.9% |
| Choctaw | 0.0 /100 | #286 | Tragic 9.9% |
| Sierra Leoneans | 0.0 /100 | #287 | Tragic 9.9% |
| Shoshone | 0.0 /100 | #288 | Tragic 10.0% |
| Hondurans | 0.0 /100 | #289 | Tragic 10.0% |
| Sub-Saharan Africans | 0.0 /100 | #290 | Tragic 10.0% |
| Immigrants | Nonimmigrants | 0.0 /100 | #291 | Tragic 10.0% |
| Carpatho Rusyns | 0.0 /100 | #292 | Tragic 10.0% |
| Haitians | 0.0 /100 | #293 | Tragic 10.0% |
| Ecuadorians | 0.0 /100 | #294 | Tragic 10.0% |
| Cherokee | 0.0 /100 | #295 | Tragic 10.0% |
| Immigrants | Western Africa | 0.0 /100 | #296 | Tragic 10.1% |
| Immigrants | Caribbean | 0.0 /100 | #297 | Tragic 10.1% |
| Immigrants | Haiti | 0.0 /100 | #298 | Tragic 10.1% |
| Immigrants | Honduras | 0.0 /100 | #299 | Tragic 10.1% |
Demographics Similar to Dominicans by Unemployment Among Women with Children Ages 6 to 17 years
In terms of unemployment among women with children ages 6 to 17 years, the demographic groups most similar to Dominicans are Cree (10.8%, a difference of 0.050%), Immigrants from Dominican Republic (10.8%, a difference of 0.060%), Cajun (10.8%, a difference of 0.24%), Liberian (10.8%, a difference of 0.31%), and Cape Verdean (10.9%, a difference of 0.38%).
| Demographics | Rating | Rank | Unemployment Among Women with Children Ages 6 to 17 years |
| Immigrants | Dominica | 0.0 /100 | #316 | Tragic 10.5% |
| Bermudans | 0.0 /100 | #317 | Tragic 10.5% |
| Delaware | 0.0 /100 | #318 | Tragic 10.5% |
| Immigrants | Uganda | 0.0 /100 | #319 | Tragic 10.7% |
| Apache | 0.0 /100 | #320 | Tragic 10.7% |
| Tohono O'odham | 0.0 /100 | #321 | Tragic 10.7% |
| Cree | 0.0 /100 | #322 | Tragic 10.8% |
| Dominicans | 0.0 /100 | #323 | Tragic 10.8% |
| Immigrants | Dominican Republic | 0.0 /100 | #324 | Tragic 10.8% |
| Cajuns | 0.0 /100 | #325 | Tragic 10.8% |
| Liberians | 0.0 /100 | #326 | Tragic 10.8% |
| Cape Verdeans | 0.0 /100 | #327 | Tragic 10.9% |
| Ottawa | 0.0 /100 | #328 | Tragic 10.9% |
| Pennsylvania Germans | 0.0 /100 | #329 | Tragic 11.0% |
| Chippewa | 0.0 /100 | #330 | Tragic 11.1% |