Carpatho Rusyn vs Immigrants from Ghana Unemployment
COMPARE
Carpatho Rusyn
Immigrants from Ghana
Unemployment
Unemployment Comparison
Carpatho Rusyns
Immigrants from Ghana
4.7%
UNEMPLOYMENT
99.9/ 100
METRIC RATING
20th/ 347
METRIC RANK
6.1%
UNEMPLOYMENT
0.0/ 100
METRIC RATING
283rd/ 347
METRIC RANK
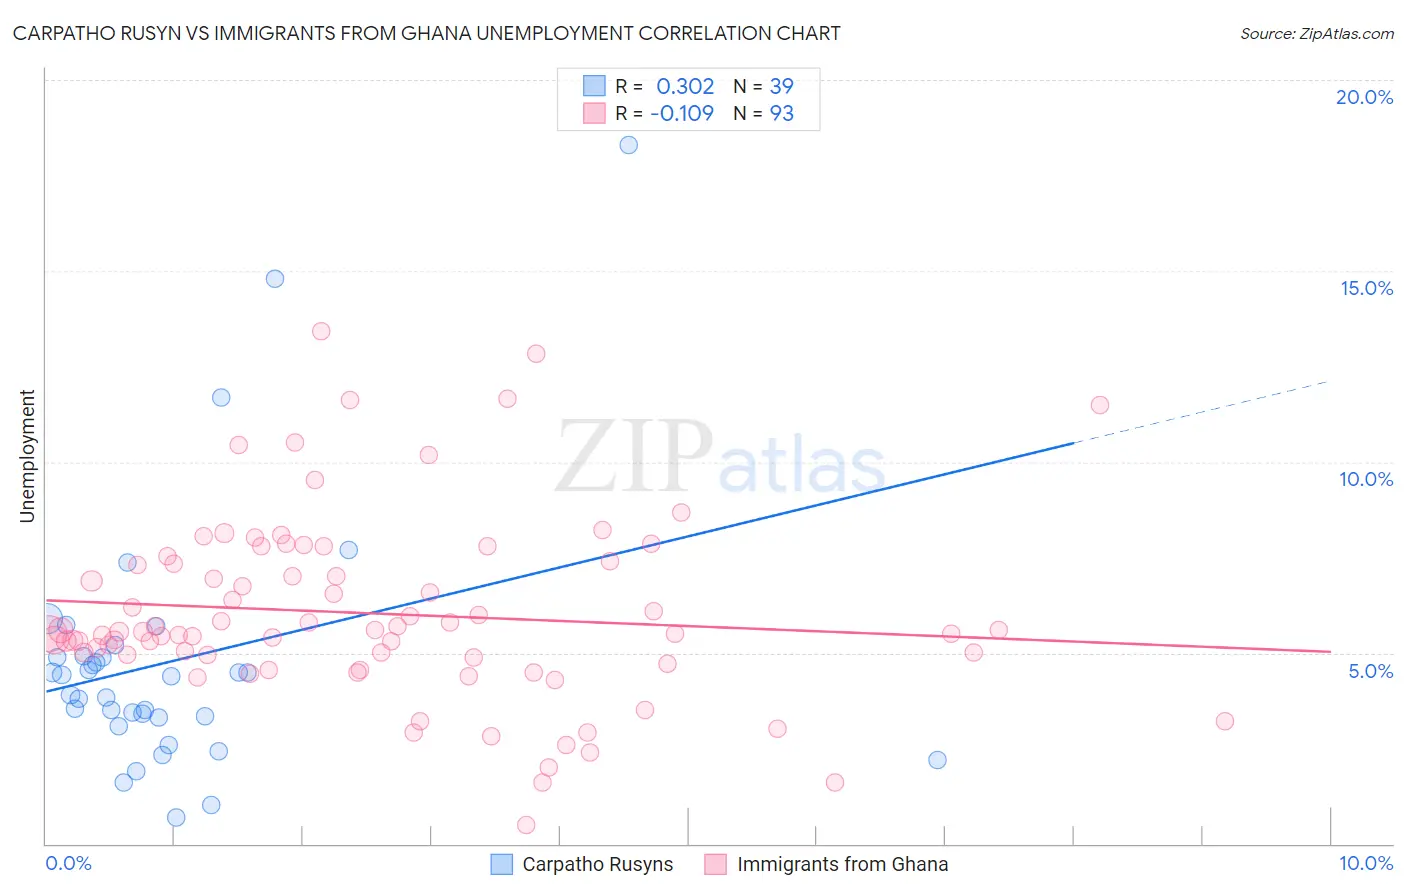
Carpatho Rusyn vs Immigrants from Ghana Unemployment Correlation Chart
The statistical analysis conducted on geographies consisting of 58,844,361 people shows a mild positive correlation between the proportion of Carpatho Rusyns and unemployment in the United States with a correlation coefficient (R) of 0.302 and weighted average of 4.7%. Similarly, the statistical analysis conducted on geographies consisting of 199,867,577 people shows a poor negative correlation between the proportion of Immigrants from Ghana and unemployment in the United States with a correlation coefficient (R) of -0.109 and weighted average of 6.1%, a difference of 29.3%.
Unemployment Correlation Summary
| Measurement | Carpatho Rusyn | Immigrants from Ghana |
| Minimum | 0.70% | 0.50% |
| Maximum | 18.3% | 13.4% |
| Range | 17.6% | 12.9% |
| Mean | 4.8% | 6.0% |
| Median | 4.4% | 5.6% |
| Interquartile 25% (IQ1) | 3.3% | 4.9% |
| Interquartile 75% (IQ3) | 4.9% | 7.4% |
| Interquartile Range (IQR) | 1.6% | 2.5% |
| Standard Deviation (Sample) | 3.4% | 2.4% |
| Standard Deviation (Population) | 3.4% | 2.4% |
Similar Demographics by Unemployment
Demographics Similar to Carpatho Rusyns by Unemployment
In terms of unemployment, the demographic groups most similar to Carpatho Rusyns are Welsh (4.7%, a difference of 0.020%), Thai (4.7%, a difference of 0.020%), British (4.7%, a difference of 0.32%), Venezuelan (4.7%, a difference of 0.40%), and Latvian (4.7%, a difference of 0.47%).
| Demographics | Rating | Rank | Unemployment |
| Belgians | 100.0 /100 | #13 | Exceptional 4.6% |
| Immigrants | Cuba | 100.0 /100 | #14 | Exceptional 4.6% |
| Europeans | 99.9 /100 | #15 | Exceptional 4.6% |
| Chinese | 99.9 /100 | #16 | Exceptional 4.7% |
| Slovenes | 99.9 /100 | #17 | Exceptional 4.7% |
| Immigrants | Venezuela | 99.9 /100 | #18 | Exceptional 4.7% |
| Scottish | 99.9 /100 | #19 | Exceptional 4.7% |
| Carpatho Rusyns | 99.9 /100 | #20 | Exceptional 4.7% |
| Welsh | 99.9 /100 | #21 | Exceptional 4.7% |
| Thais | 99.9 /100 | #22 | Exceptional 4.7% |
| British | 99.9 /100 | #23 | Exceptional 4.7% |
| Venezuelans | 99.9 /100 | #24 | Exceptional 4.7% |
| Latvians | 99.9 /100 | #25 | Exceptional 4.7% |
| Bulgarians | 99.9 /100 | #26 | Exceptional 4.7% |
| Finns | 99.9 /100 | #27 | Exceptional 4.7% |
Demographics Similar to Immigrants from Ghana by Unemployment
In terms of unemployment, the demographic groups most similar to Immigrants from Ghana are Immigrants from the Azores (6.1%, a difference of 0.080%), Aleut (6.1%, a difference of 0.13%), African (6.1%, a difference of 0.15%), Immigrants from Mexico (6.0%, a difference of 0.73%), and Immigrants from Western Africa (6.0%, a difference of 0.73%).
| Demographics | Rating | Rank | Unemployment |
| Immigrants | Central America | 0.0 /100 | #276 | Tragic 6.0% |
| Armenians | 0.0 /100 | #277 | Tragic 6.0% |
| Ghanaians | 0.0 /100 | #278 | Tragic 6.0% |
| Immigrants | Mexico | 0.0 /100 | #279 | Tragic 6.0% |
| Immigrants | Western Africa | 0.0 /100 | #280 | Tragic 6.0% |
| Africans | 0.0 /100 | #281 | Tragic 6.1% |
| Immigrants | Azores | 0.0 /100 | #282 | Tragic 6.1% |
| Immigrants | Ghana | 0.0 /100 | #283 | Tragic 6.1% |
| Aleuts | 0.0 /100 | #284 | Tragic 6.1% |
| Immigrants | Senegal | 0.0 /100 | #285 | Tragic 6.1% |
| Immigrants | Caribbean | 0.0 /100 | #286 | Tragic 6.2% |
| Nepalese | 0.0 /100 | #287 | Tragic 6.2% |
| Ecuadorians | 0.0 /100 | #288 | Tragic 6.2% |
| Chippewa | 0.0 /100 | #289 | Tragic 6.2% |
| Senegalese | 0.0 /100 | #290 | Tragic 6.2% |