Immigrants from Senegal vs Immigrants from Ghana Unemployment
COMPARE
Immigrants from Senegal
Immigrants from Ghana
Unemployment
Unemployment Comparison
Immigrants from Senegal
Immigrants from Ghana
6.1%
UNEMPLOYMENT
0.0/ 100
METRIC RATING
285th/ 347
METRIC RANK
6.1%
UNEMPLOYMENT
0.0/ 100
METRIC RATING
283rd/ 347
METRIC RANK
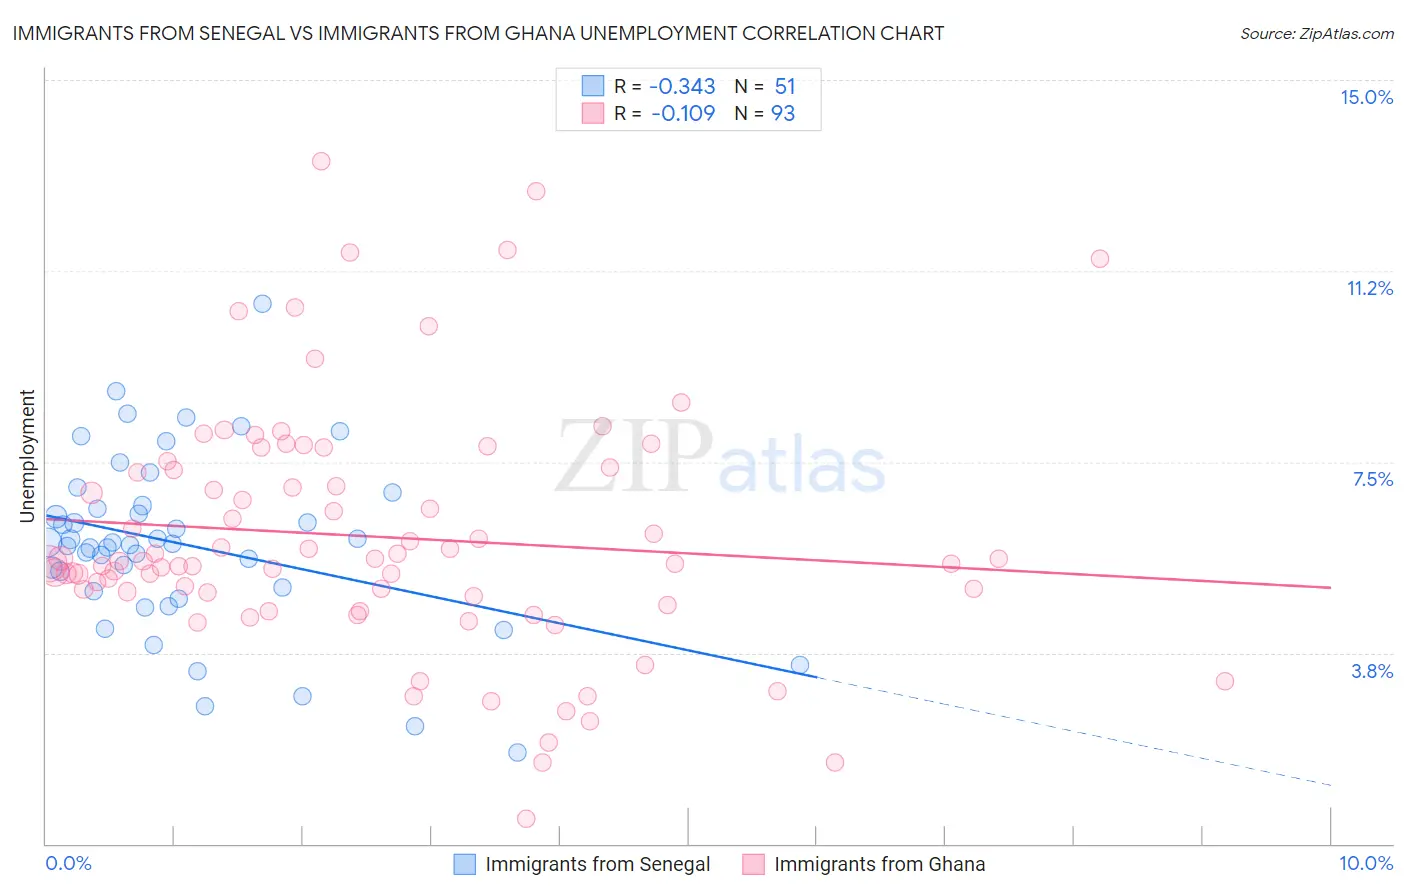
Immigrants from Senegal vs Immigrants from Ghana Unemployment Correlation Chart
The statistical analysis conducted on geographies consisting of 90,076,703 people shows a mild negative correlation between the proportion of Immigrants from Senegal and unemployment in the United States with a correlation coefficient (R) of -0.343 and weighted average of 6.1%. Similarly, the statistical analysis conducted on geographies consisting of 199,867,577 people shows a poor negative correlation between the proportion of Immigrants from Ghana and unemployment in the United States with a correlation coefficient (R) of -0.109 and weighted average of 6.1%, a difference of 1.1%.
Unemployment Correlation Summary
| Measurement | Immigrants from Senegal | Immigrants from Ghana |
| Minimum | 1.8% | 0.50% |
| Maximum | 10.6% | 13.4% |
| Range | 8.8% | 12.9% |
| Mean | 5.9% | 6.0% |
| Median | 5.9% | 5.6% |
| Interquartile 25% (IQ1) | 5.0% | 4.9% |
| Interquartile 75% (IQ3) | 6.6% | 7.4% |
| Interquartile Range (IQR) | 1.7% | 2.5% |
| Standard Deviation (Sample) | 1.7% | 2.4% |
| Standard Deviation (Population) | 1.7% | 2.4% |
Demographics Similar to Immigrants from Senegal and Immigrants from Ghana by Unemployment
In terms of unemployment, the demographic groups most similar to Immigrants from Senegal are Immigrants from Caribbean (6.2%, a difference of 0.43%), Nepalese (6.2%, a difference of 0.76%), Ecuadorian (6.2%, a difference of 0.79%), Aleut (6.1%, a difference of 0.93%), and Chippewa (6.2%, a difference of 1.1%). Similarly, the demographic groups most similar to Immigrants from Ghana are Immigrants from the Azores (6.1%, a difference of 0.080%), Aleut (6.1%, a difference of 0.13%), African (6.1%, a difference of 0.15%), Immigrants from Mexico (6.0%, a difference of 0.73%), and Immigrants from Western Africa (6.0%, a difference of 0.73%).
| Demographics | Rating | Rank | Unemployment |
| Bahamians | 0.0 /100 | #274 | Tragic 5.9% |
| Immigrants | Latin America | 0.0 /100 | #275 | Tragic 5.9% |
| Immigrants | Central America | 0.0 /100 | #276 | Tragic 6.0% |
| Armenians | 0.0 /100 | #277 | Tragic 6.0% |
| Ghanaians | 0.0 /100 | #278 | Tragic 6.0% |
| Immigrants | Mexico | 0.0 /100 | #279 | Tragic 6.0% |
| Immigrants | Western Africa | 0.0 /100 | #280 | Tragic 6.0% |
| Africans | 0.0 /100 | #281 | Tragic 6.1% |
| Immigrants | Azores | 0.0 /100 | #282 | Tragic 6.1% |
| Immigrants | Ghana | 0.0 /100 | #283 | Tragic 6.1% |
| Aleuts | 0.0 /100 | #284 | Tragic 6.1% |
| Immigrants | Senegal | 0.0 /100 | #285 | Tragic 6.1% |
| Immigrants | Caribbean | 0.0 /100 | #286 | Tragic 6.2% |
| Nepalese | 0.0 /100 | #287 | Tragic 6.2% |
| Ecuadorians | 0.0 /100 | #288 | Tragic 6.2% |
| Chippewa | 0.0 /100 | #289 | Tragic 6.2% |
| Senegalese | 0.0 /100 | #290 | Tragic 6.2% |
| Haitians | 0.0 /100 | #291 | Tragic 6.2% |
| Central American Indians | 0.0 /100 | #292 | Tragic 6.2% |
| Immigrants | Ecuador | 0.0 /100 | #293 | Tragic 6.2% |
| Spanish American Indians | 0.0 /100 | #294 | Tragic 6.2% |