Carpatho Rusyn vs Immigrants from Ecuador Unemployment
COMPARE
Carpatho Rusyn
Immigrants from Ecuador
Unemployment
Unemployment Comparison
Carpatho Rusyns
Immigrants from Ecuador
4.7%
UNEMPLOYMENT
99.9/ 100
METRIC RATING
20th/ 347
METRIC RANK
6.2%
UNEMPLOYMENT
0.0/ 100
METRIC RATING
293rd/ 347
METRIC RANK
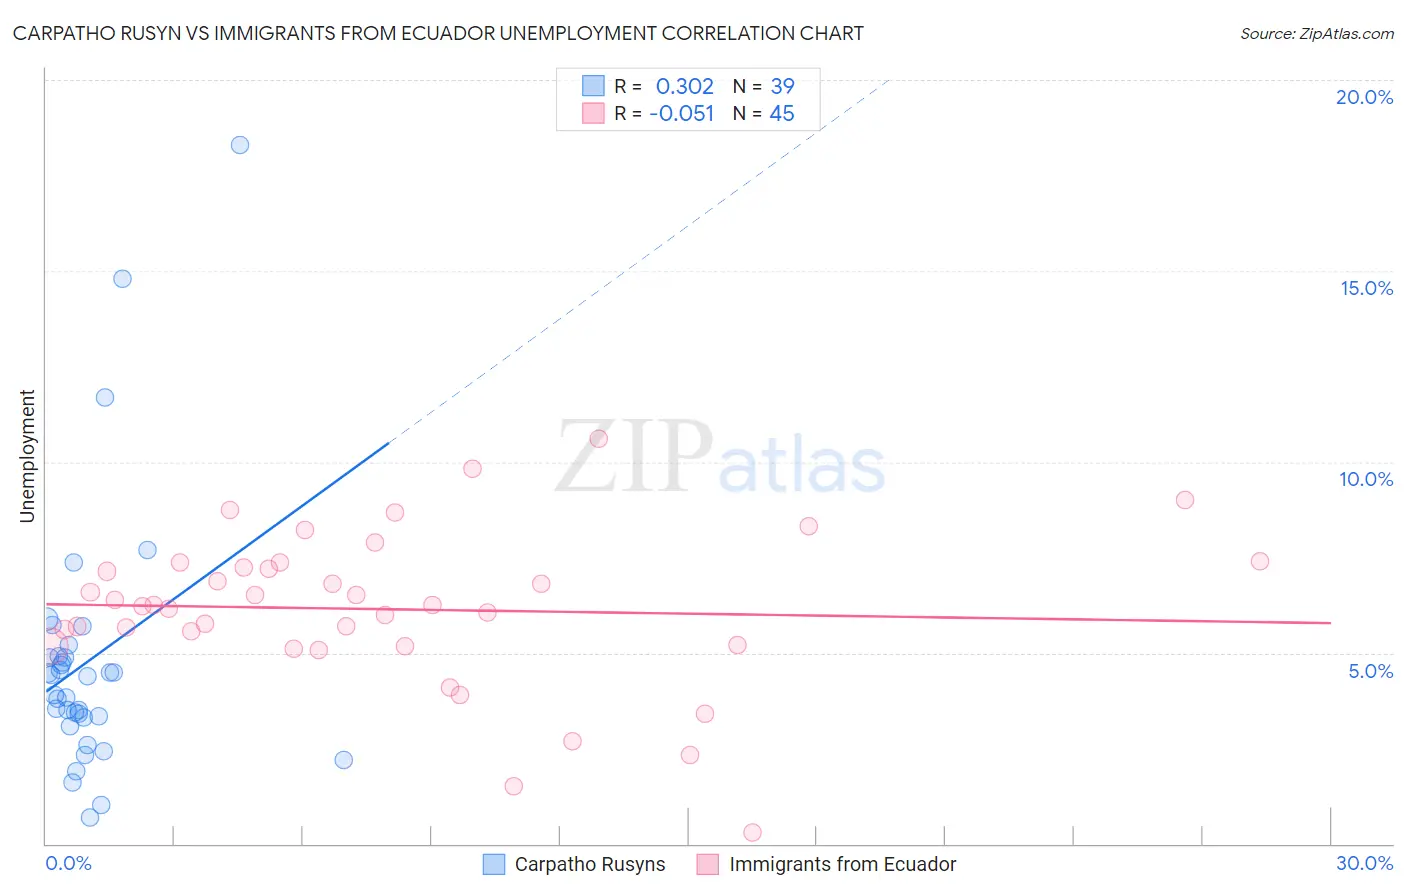
Carpatho Rusyn vs Immigrants from Ecuador Unemployment Correlation Chart
The statistical analysis conducted on geographies consisting of 58,844,361 people shows a mild positive correlation between the proportion of Carpatho Rusyns and unemployment in the United States with a correlation coefficient (R) of 0.302 and weighted average of 4.7%. Similarly, the statistical analysis conducted on geographies consisting of 270,858,036 people shows a slight negative correlation between the proportion of Immigrants from Ecuador and unemployment in the United States with a correlation coefficient (R) of -0.051 and weighted average of 6.2%, a difference of 33.1%.
Unemployment Correlation Summary
| Measurement | Carpatho Rusyn | Immigrants from Ecuador |
| Minimum | 0.70% | 0.30% |
| Maximum | 18.3% | 10.6% |
| Range | 17.6% | 10.3% |
| Mean | 4.8% | 6.1% |
| Median | 4.4% | 6.3% |
| Interquartile 25% (IQ1) | 3.3% | 5.2% |
| Interquartile 75% (IQ3) | 4.9% | 7.3% |
| Interquartile Range (IQR) | 1.6% | 2.1% |
| Standard Deviation (Sample) | 3.4% | 2.0% |
| Standard Deviation (Population) | 3.4% | 2.0% |
Similar Demographics by Unemployment
Demographics Similar to Carpatho Rusyns by Unemployment
In terms of unemployment, the demographic groups most similar to Carpatho Rusyns are Welsh (4.7%, a difference of 0.020%), Thai (4.7%, a difference of 0.020%), British (4.7%, a difference of 0.32%), Venezuelan (4.7%, a difference of 0.40%), and Latvian (4.7%, a difference of 0.47%).
| Demographics | Rating | Rank | Unemployment |
| Belgians | 100.0 /100 | #13 | Exceptional 4.6% |
| Immigrants | Cuba | 100.0 /100 | #14 | Exceptional 4.6% |
| Europeans | 99.9 /100 | #15 | Exceptional 4.6% |
| Chinese | 99.9 /100 | #16 | Exceptional 4.7% |
| Slovenes | 99.9 /100 | #17 | Exceptional 4.7% |
| Immigrants | Venezuela | 99.9 /100 | #18 | Exceptional 4.7% |
| Scottish | 99.9 /100 | #19 | Exceptional 4.7% |
| Carpatho Rusyns | 99.9 /100 | #20 | Exceptional 4.7% |
| Welsh | 99.9 /100 | #21 | Exceptional 4.7% |
| Thais | 99.9 /100 | #22 | Exceptional 4.7% |
| British | 99.9 /100 | #23 | Exceptional 4.7% |
| Venezuelans | 99.9 /100 | #24 | Exceptional 4.7% |
| Latvians | 99.9 /100 | #25 | Exceptional 4.7% |
| Bulgarians | 99.9 /100 | #26 | Exceptional 4.7% |
| Finns | 99.9 /100 | #27 | Exceptional 4.7% |
Demographics Similar to Immigrants from Ecuador by Unemployment
In terms of unemployment, the demographic groups most similar to Immigrants from Ecuador are Spanish American Indian (6.2%, a difference of 0.0%), Central American Indian (6.2%, a difference of 0.090%), Haitian (6.2%, a difference of 0.11%), U.S. Virgin Islander (6.3%, a difference of 0.12%), and Ute (6.3%, a difference of 0.57%).
| Demographics | Rating | Rank | Unemployment |
| Immigrants | Caribbean | 0.0 /100 | #286 | Tragic 6.2% |
| Nepalese | 0.0 /100 | #287 | Tragic 6.2% |
| Ecuadorians | 0.0 /100 | #288 | Tragic 6.2% |
| Chippewa | 0.0 /100 | #289 | Tragic 6.2% |
| Senegalese | 0.0 /100 | #290 | Tragic 6.2% |
| Haitians | 0.0 /100 | #291 | Tragic 6.2% |
| Central American Indians | 0.0 /100 | #292 | Tragic 6.2% |
| Immigrants | Ecuador | 0.0 /100 | #293 | Tragic 6.2% |
| Spanish American Indians | 0.0 /100 | #294 | Tragic 6.2% |
| U.S. Virgin Islanders | 0.0 /100 | #295 | Tragic 6.3% |
| Ute | 0.0 /100 | #296 | Tragic 6.3% |
| Jamaicans | 0.0 /100 | #297 | Tragic 6.3% |
| Immigrants | Haiti | 0.0 /100 | #298 | Tragic 6.3% |
| Immigrants | West Indies | 0.0 /100 | #299 | Tragic 6.3% |
| Immigrants | Trinidad and Tobago | 0.0 /100 | #300 | Tragic 6.3% |