Carpatho Rusyn vs Dominican Bachelor's Degree
COMPARE
Carpatho Rusyn
Dominican
Bachelor's Degree
Bachelor's Degree Comparison
Carpatho Rusyns
Dominicans
42.1%
BACHELOR'S DEGREE
99.0/ 100
METRIC RATING
87th/ 347
METRIC RANK
31.8%
BACHELOR'S DEGREE
0.1/ 100
METRIC RATING
277th/ 347
METRIC RANK
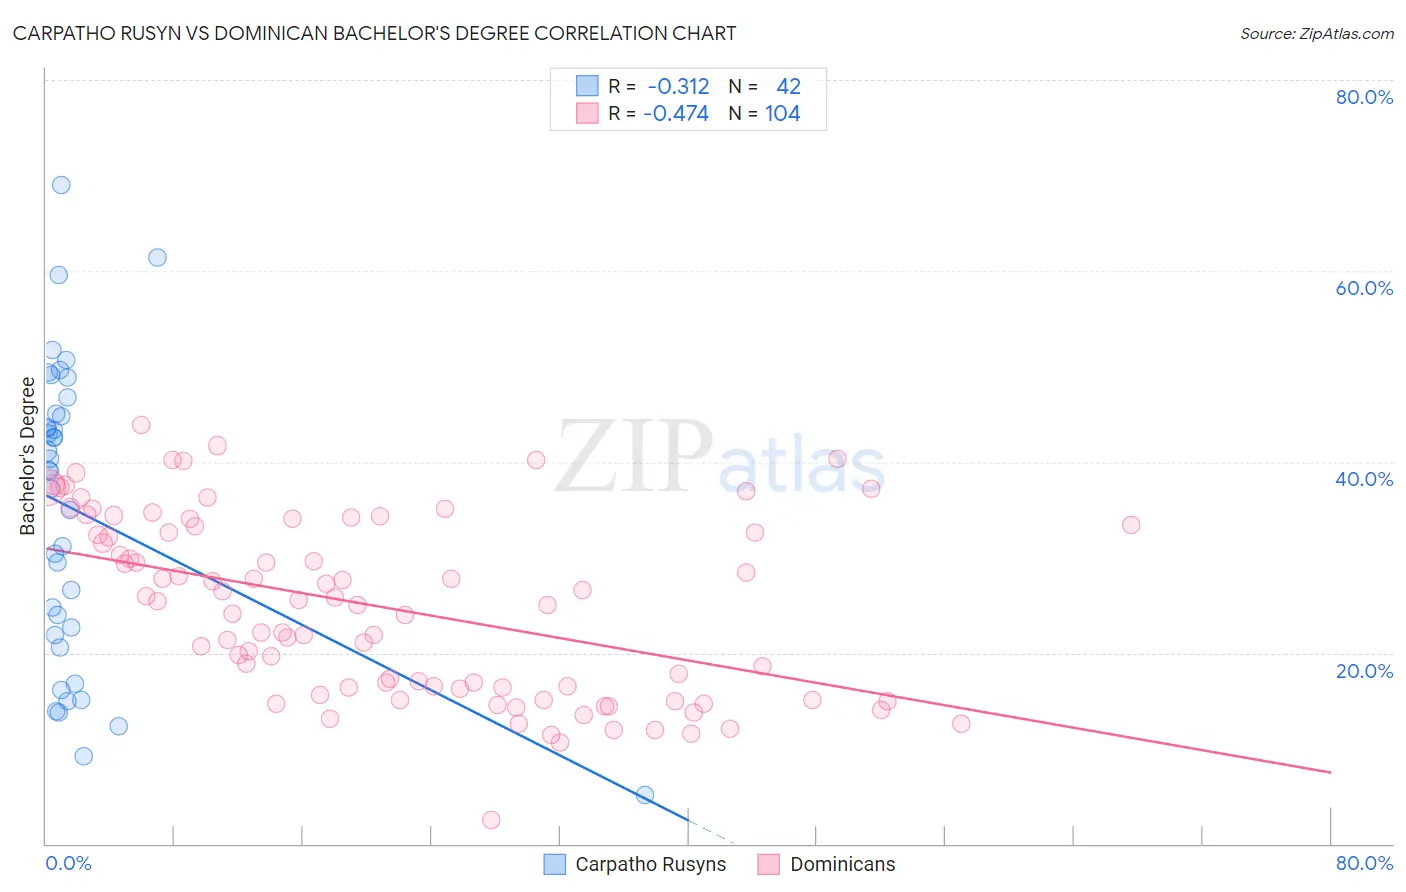
Carpatho Rusyn vs Dominican Bachelor's Degree Correlation Chart
The statistical analysis conducted on geographies consisting of 58,871,690 people shows a mild negative correlation between the proportion of Carpatho Rusyns and percentage of population with at least bachelor's degree education in the United States with a correlation coefficient (R) of -0.312 and weighted average of 42.1%. Similarly, the statistical analysis conducted on geographies consisting of 355,082,145 people shows a moderate negative correlation between the proportion of Dominicans and percentage of population with at least bachelor's degree education in the United States with a correlation coefficient (R) of -0.474 and weighted average of 31.8%, a difference of 32.6%.
Bachelor's Degree Correlation Summary
| Measurement | Carpatho Rusyn | Dominican |
| Minimum | 5.1% | 2.5% |
| Maximum | 69.0% | 43.9% |
| Range | 63.9% | 41.4% |
| Mean | 34.9% | 24.8% |
| Median | 39.1% | 25.2% |
| Interquartile 25% (IQ1) | 21.8% | 16.3% |
| Interquartile 75% (IQ3) | 45.0% | 33.3% |
| Interquartile Range (IQR) | 23.2% | 17.0% |
| Standard Deviation (Sample) | 15.6% | 9.4% |
| Standard Deviation (Population) | 15.4% | 9.3% |
Similar Demographics by Bachelor's Degree
Demographics Similar to Carpatho Rusyns by Bachelor's Degree
In terms of bachelor's degree, the demographic groups most similar to Carpatho Rusyns are Immigrants from Western Europe (42.0%, a difference of 0.12%), Greek (42.0%, a difference of 0.12%), Laotian (42.0%, a difference of 0.25%), Immigrants from Brazil (42.2%, a difference of 0.30%), and Immigrants from Northern Africa (41.9%, a difference of 0.35%).
| Demographics | Rating | Rank | Bachelor's Degree |
| Immigrants | Croatia | 99.2 /100 | #80 | Exceptional 42.3% |
| Immigrants | Hungary | 99.2 /100 | #81 | Exceptional 42.3% |
| Immigrants | Scotland | 99.2 /100 | #82 | Exceptional 42.3% |
| Armenians | 99.2 /100 | #83 | Exceptional 42.3% |
| Immigrants | Western Asia | 99.2 /100 | #84 | Exceptional 42.3% |
| Lithuanians | 99.2 /100 | #85 | Exceptional 42.2% |
| Immigrants | Brazil | 99.2 /100 | #86 | Exceptional 42.2% |
| Carpatho Rusyns | 99.0 /100 | #87 | Exceptional 42.1% |
| Immigrants | Western Europe | 99.0 /100 | #88 | Exceptional 42.0% |
| Greeks | 99.0 /100 | #89 | Exceptional 42.0% |
| Laotians | 98.9 /100 | #90 | Exceptional 42.0% |
| Immigrants | Northern Africa | 98.9 /100 | #91 | Exceptional 41.9% |
| Maltese | 98.8 /100 | #92 | Exceptional 41.9% |
| Immigrants | Canada | 98.6 /100 | #93 | Exceptional 41.7% |
| Immigrants | Nepal | 98.6 /100 | #94 | Exceptional 41.7% |
Demographics Similar to Dominicans by Bachelor's Degree
In terms of bachelor's degree, the demographic groups most similar to Dominicans are Marshallese (31.7%, a difference of 0.050%), Salvadoran (31.8%, a difference of 0.15%), Samoan (31.8%, a difference of 0.19%), Potawatomi (31.9%, a difference of 0.32%), and American (31.9%, a difference of 0.34%).
| Demographics | Rating | Rank | Bachelor's Degree |
| Immigrants | Nicaragua | 0.2 /100 | #270 | Tragic 31.9% |
| Central Americans | 0.2 /100 | #271 | Tragic 31.9% |
| Comanche | 0.2 /100 | #272 | Tragic 31.9% |
| Americans | 0.2 /100 | #273 | Tragic 31.9% |
| Potawatomi | 0.2 /100 | #274 | Tragic 31.9% |
| Samoans | 0.1 /100 | #275 | Tragic 31.8% |
| Salvadorans | 0.1 /100 | #276 | Tragic 31.8% |
| Dominicans | 0.1 /100 | #277 | Tragic 31.8% |
| Marshallese | 0.1 /100 | #278 | Tragic 31.7% |
| Hawaiians | 0.1 /100 | #279 | Tragic 31.6% |
| Immigrants | Laos | 0.1 /100 | #280 | Tragic 31.6% |
| Blackfeet | 0.1 /100 | #281 | Tragic 31.5% |
| Immigrants | Caribbean | 0.1 /100 | #282 | Tragic 31.4% |
| Hondurans | 0.1 /100 | #283 | Tragic 31.3% |
| Haitians | 0.1 /100 | #284 | Tragic 31.3% |