Cheyenne vs Ugandan Unemployment
COMPARE
Cheyenne
Ugandan
Unemployment
Unemployment Comparison
Cheyenne
Ugandans
8.0%
UNEMPLOYMENT
0.0/ 100
METRIC RATING
337th/ 347
METRIC RANK
5.4%
UNEMPLOYMENT
18.0/ 100
METRIC RATING
212th/ 347
METRIC RANK
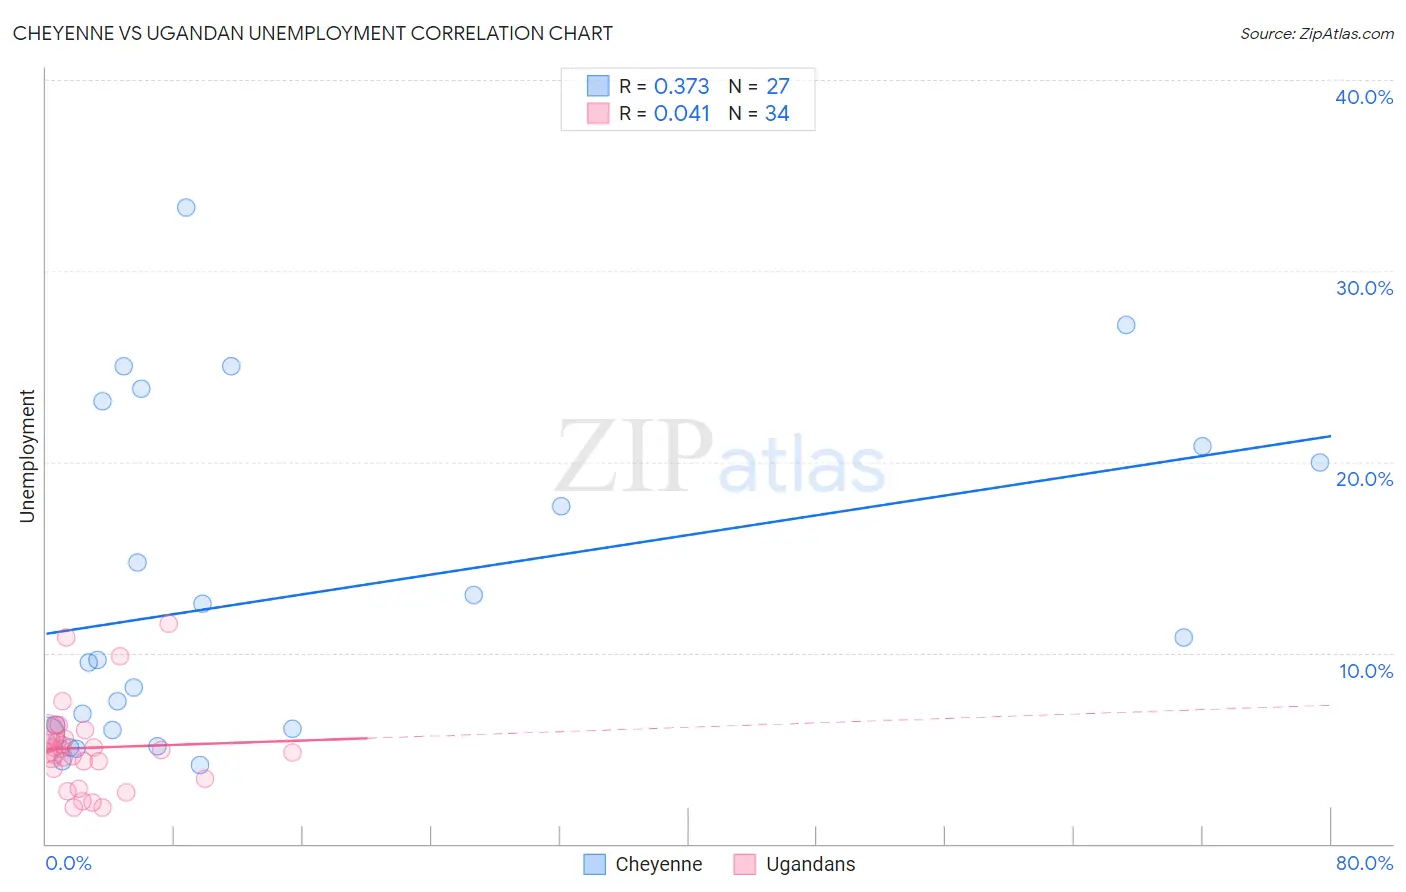
Cheyenne vs Ugandan Unemployment Correlation Chart
The statistical analysis conducted on geographies consisting of 80,656,490 people shows a mild positive correlation between the proportion of Cheyenne and unemployment in the United States with a correlation coefficient (R) of 0.373 and weighted average of 8.0%. Similarly, the statistical analysis conducted on geographies consisting of 94,004,444 people shows no correlation between the proportion of Ugandans and unemployment in the United States with a correlation coefficient (R) of 0.041 and weighted average of 5.4%, a difference of 48.7%.
Unemployment Correlation Summary
| Measurement | Cheyenne | Ugandan |
| Minimum | 4.1% | 1.9% |
| Maximum | 33.3% | 11.5% |
| Range | 29.2% | 9.6% |
| Mean | 13.2% | 5.0% |
| Median | 9.6% | 4.8% |
| Interquartile 25% (IQ1) | 6.0% | 3.9% |
| Interquartile 75% (IQ3) | 20.8% | 5.5% |
| Interquartile Range (IQR) | 14.8% | 1.6% |
| Standard Deviation (Sample) | 8.6% | 2.2% |
| Standard Deviation (Population) | 8.4% | 2.2% |
Similar Demographics by Unemployment
Demographics Similar to Cheyenne by Unemployment
In terms of unemployment, the demographic groups most similar to Cheyenne are Pima (8.2%, a difference of 2.8%), Immigrants from Yemen (7.7%, a difference of 3.8%), Navajo (8.4%, a difference of 4.4%), Alaskan Athabascan (7.7%, a difference of 4.6%), and Puerto Rican (8.4%, a difference of 5.2%).
| Demographics | Rating | Rank | Unemployment |
| Yakama | 0.0 /100 | #330 | Tragic 7.3% |
| Dominicans | 0.0 /100 | #331 | Tragic 7.4% |
| Sioux | 0.0 /100 | #332 | Tragic 7.4% |
| Immigrants | Dominican Republic | 0.0 /100 | #333 | Tragic 7.4% |
| Apache | 0.0 /100 | #334 | Tragic 7.4% |
| Alaskan Athabascans | 0.0 /100 | #335 | Tragic 7.7% |
| Immigrants | Yemen | 0.0 /100 | #336 | Tragic 7.7% |
| Cheyenne | 0.0 /100 | #337 | Tragic 8.0% |
| Pima | 0.0 /100 | #338 | Tragic 8.2% |
| Navajo | 0.0 /100 | #339 | Tragic 8.4% |
| Puerto Ricans | 0.0 /100 | #340 | Tragic 8.4% |
| Tohono O'odham | 0.0 /100 | #341 | Tragic 8.9% |
| Hopi | 0.0 /100 | #342 | Tragic 8.9% |
| Yuman | 0.0 /100 | #343 | Tragic 9.1% |
| Arapaho | 0.0 /100 | #344 | Tragic 9.8% |
Demographics Similar to Ugandans by Unemployment
In terms of unemployment, the demographic groups most similar to Ugandans are Iraqi (5.4%, a difference of 0.010%), Immigrants from Iraq (5.4%, a difference of 0.060%), Immigrants from Iran (5.4%, a difference of 0.080%), Portuguese (5.4%, a difference of 0.11%), and Creek (5.4%, a difference of 0.14%).
| Demographics | Rating | Rank | Unemployment |
| Native Hawaiians | 24.1 /100 | #205 | Fair 5.3% |
| Immigrants | Peru | 22.7 /100 | #206 | Fair 5.4% |
| Creek | 19.4 /100 | #207 | Poor 5.4% |
| Portuguese | 19.0 /100 | #208 | Poor 5.4% |
| Immigrants | Iran | 18.8 /100 | #209 | Poor 5.4% |
| Immigrants | Iraq | 18.6 /100 | #210 | Poor 5.4% |
| Iraqis | 18.1 /100 | #211 | Poor 5.4% |
| Ugandans | 18.0 /100 | #212 | Poor 5.4% |
| Immigrants | Middle Africa | 15.3 /100 | #213 | Poor 5.4% |
| Immigrants | Costa Rica | 15.2 /100 | #214 | Poor 5.4% |
| Delaware | 14.7 /100 | #215 | Poor 5.4% |
| Immigrants | South America | 13.5 /100 | #216 | Poor 5.4% |
| Immigrants | Albania | 13.5 /100 | #217 | Poor 5.4% |
| Choctaw | 12.7 /100 | #218 | Poor 5.4% |
| Bangladeshis | 11.2 /100 | #219 | Poor 5.4% |