Cambodian vs Swiss Unemployment Among Ages 65 to 74 years
COMPARE
Cambodian
Swiss
Unemployment Among Ages 65 to 74 years
Unemployment Among Ages 65 to 74 years Comparison
Cambodians
Swiss
5.0%
UNEMPLOYMENT AMONG AGES 65 TO 74 YEARS
100.0/ 100
METRIC RATING
34th/ 347
METRIC RANK
5.1%
UNEMPLOYMENT AMONG AGES 65 TO 74 YEARS
99.2/ 100
METRIC RATING
67th/ 347
METRIC RANK
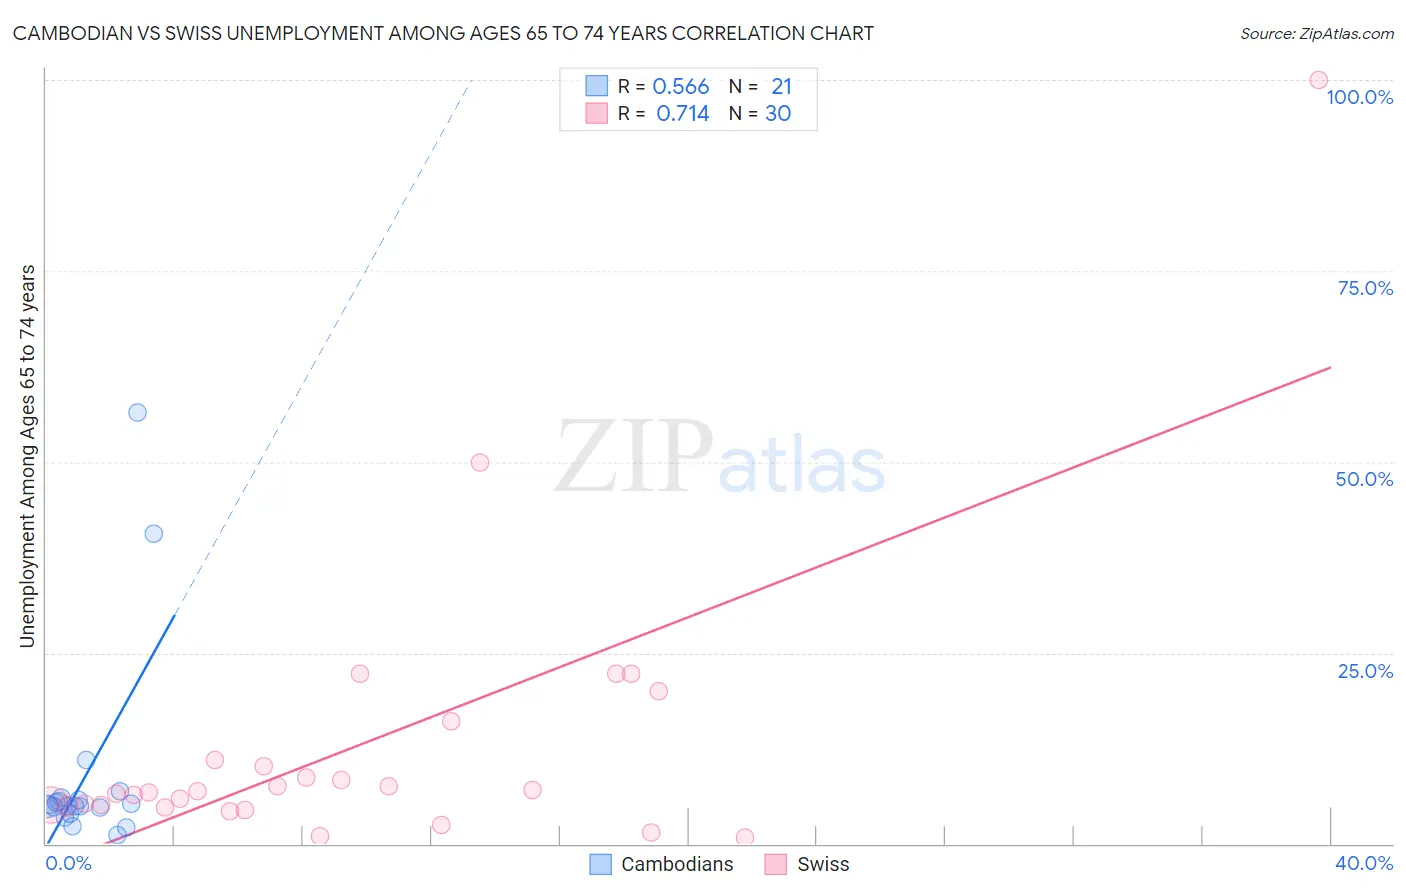
Cambodian vs Swiss Unemployment Among Ages 65 to 74 years Correlation Chart
The statistical analysis conducted on geographies consisting of 98,775,189 people shows a substantial positive correlation between the proportion of Cambodians and unemployment rate among population between the ages 65 and 74 in the United States with a correlation coefficient (R) of 0.566 and weighted average of 5.0%. Similarly, the statistical analysis conducted on geographies consisting of 386,932,996 people shows a strong positive correlation between the proportion of Swiss and unemployment rate among population between the ages 65 and 74 in the United States with a correlation coefficient (R) of 0.714 and weighted average of 5.1%, a difference of 2.7%.
Unemployment Among Ages 65 to 74 years Correlation Summary
| Measurement | Cambodian | Swiss |
| Minimum | 1.2% | 0.90% |
| Maximum | 56.5% | 100.0% |
| Range | 55.3% | 99.1% |
| Mean | 9.1% | 12.8% |
| Median | 5.0% | 6.8% |
| Interquartile 25% (IQ1) | 4.4% | 4.9% |
| Interquartile 75% (IQ3) | 5.8% | 11.0% |
| Interquartile Range (IQR) | 1.5% | 6.1% |
| Standard Deviation (Sample) | 13.5% | 19.1% |
| Standard Deviation (Population) | 13.2% | 18.8% |
Similar Demographics by Unemployment Among Ages 65 to 74 years
Demographics Similar to Cambodians by Unemployment Among Ages 65 to 74 years
In terms of unemployment among ages 65 to 74 years, the demographic groups most similar to Cambodians are Belgian (5.0%, a difference of 0.0%), Palestinian (5.0%, a difference of 0.060%), Bhutanese (5.0%, a difference of 0.11%), Immigrants from Kuwait (5.0%, a difference of 0.30%), and Immigrants from Eastern Africa (5.0%, a difference of 0.31%).
| Demographics | Rating | Rank | Unemployment Among Ages 65 to 74 years |
| Norwegians | 100.0 /100 | #27 | Exceptional 5.0% |
| Bulgarians | 100.0 /100 | #28 | Exceptional 5.0% |
| Ethiopians | 100.0 /100 | #29 | Exceptional 5.0% |
| Immigrants | Lebanon | 100.0 /100 | #30 | Exceptional 5.0% |
| Slovenes | 100.0 /100 | #31 | Exceptional 5.0% |
| Palestinians | 100.0 /100 | #32 | Exceptional 5.0% |
| Belgians | 100.0 /100 | #33 | Exceptional 5.0% |
| Cambodians | 100.0 /100 | #34 | Exceptional 5.0% |
| Bhutanese | 100.0 /100 | #35 | Exceptional 5.0% |
| Immigrants | Kuwait | 99.9 /100 | #36 | Exceptional 5.0% |
| Immigrants | Eastern Africa | 99.9 /100 | #37 | Exceptional 5.0% |
| Nepalese | 99.9 /100 | #38 | Exceptional 5.0% |
| Immigrants | Sweden | 99.9 /100 | #39 | Exceptional 5.0% |
| Immigrants | Iraq | 99.9 /100 | #40 | Exceptional 5.1% |
| Ugandans | 99.9 /100 | #41 | Exceptional 5.1% |
Demographics Similar to Swiss by Unemployment Among Ages 65 to 74 years
In terms of unemployment among ages 65 to 74 years, the demographic groups most similar to Swiss are Latvian (5.1%, a difference of 0.010%), Iroquois (5.1%, a difference of 0.050%), Scandinavian (5.2%, a difference of 0.070%), Immigrants from Moldova (5.1%, a difference of 0.090%), and Bolivian (5.1%, a difference of 0.090%).
| Demographics | Rating | Rank | Unemployment Among Ages 65 to 74 years |
| Immigrants | Jordan | 99.4 /100 | #60 | Exceptional 5.1% |
| Immigrants | Taiwan | 99.4 /100 | #61 | Exceptional 5.1% |
| Nicaraguans | 99.4 /100 | #62 | Exceptional 5.1% |
| Kiowa | 99.3 /100 | #63 | Exceptional 5.1% |
| Immigrants | Moldova | 99.3 /100 | #64 | Exceptional 5.1% |
| Bolivians | 99.3 /100 | #65 | Exceptional 5.1% |
| Iroquois | 99.3 /100 | #66 | Exceptional 5.1% |
| Swiss | 99.2 /100 | #67 | Exceptional 5.1% |
| Latvians | 99.2 /100 | #68 | Exceptional 5.1% |
| Scandinavians | 99.1 /100 | #69 | Exceptional 5.2% |
| Immigrants | Japan | 99.1 /100 | #70 | Exceptional 5.2% |
| Scotch-Irish | 99.0 /100 | #71 | Exceptional 5.2% |
| Immigrants | Oceania | 99.0 /100 | #72 | Exceptional 5.2% |
| Filipinos | 99.0 /100 | #73 | Exceptional 5.2% |
| Afghans | 99.0 /100 | #74 | Exceptional 5.2% |