Cajun vs Tsimshian Unemployment Among Ages 20 to 24 years
COMPARE
Cajun
Tsimshian
Unemployment Among Ages 20 to 24 years
Unemployment Among Ages 20 to 24 years Comparison
Cajuns
Tsimshian
12.0%
UNEMPLOYMENT AMONG AGES 20 TO 24 YEARS
0.0/ 100
METRIC RATING
296th/ 347
METRIC RANK
18.0%
UNEMPLOYMENT AMONG AGES 20 TO 24 YEARS
0.0/ 100
METRIC RATING
343rd/ 347
METRIC RANK
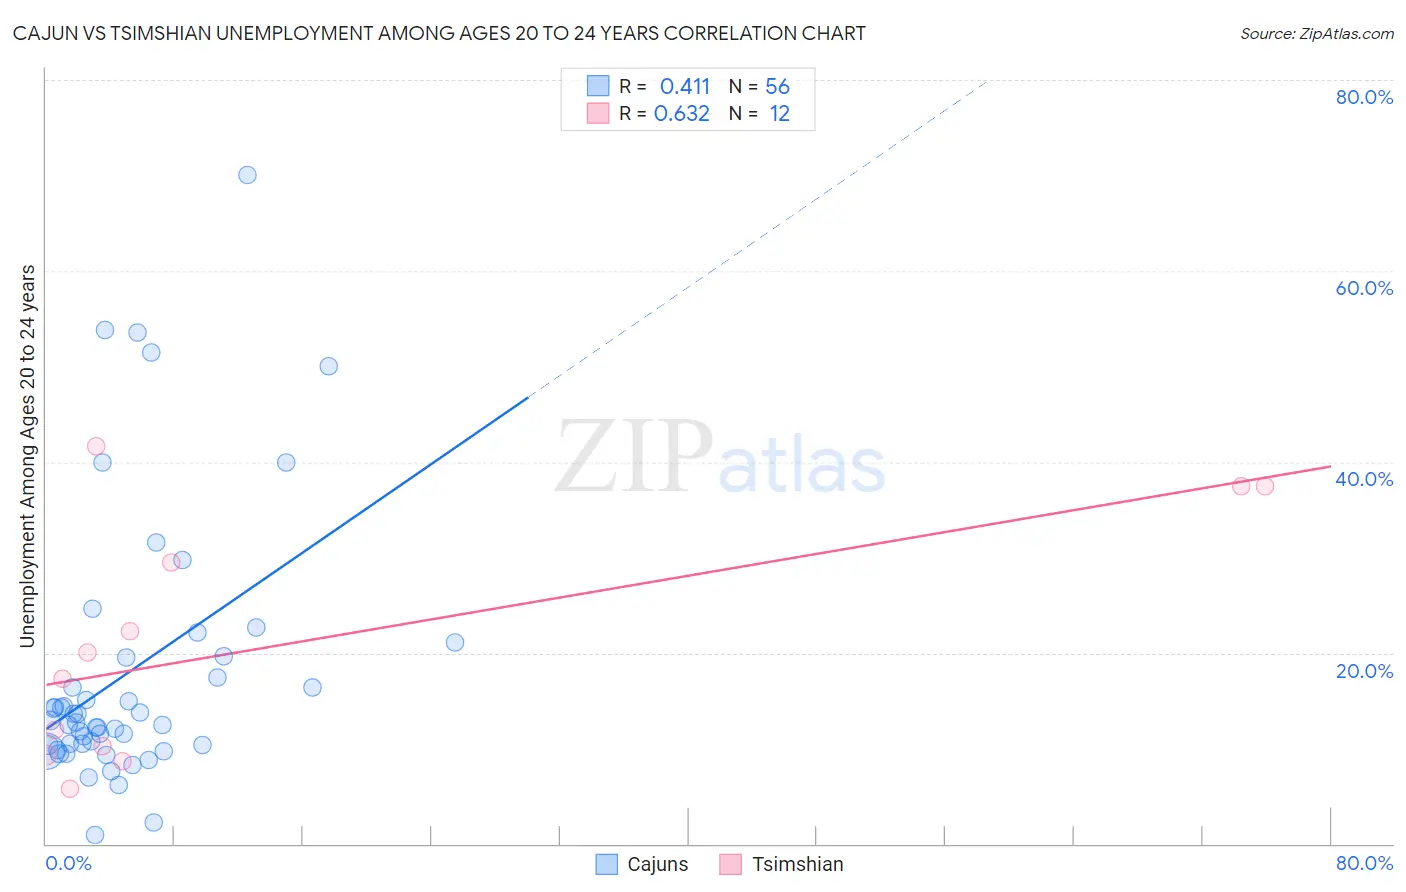
Cajun vs Tsimshian Unemployment Among Ages 20 to 24 years Correlation Chart
The statistical analysis conducted on geographies consisting of 146,212,599 people shows a moderate positive correlation between the proportion of Cajuns and unemployment rate among population between the ages 20 and 24 in the United States with a correlation coefficient (R) of 0.411 and weighted average of 12.0%. Similarly, the statistical analysis conducted on geographies consisting of 15,555,323 people shows a significant positive correlation between the proportion of Tsimshian and unemployment rate among population between the ages 20 and 24 in the United States with a correlation coefficient (R) of 0.632 and weighted average of 18.0%, a difference of 50.1%.
Unemployment Among Ages 20 to 24 years Correlation Summary
| Measurement | Cajun | Tsimshian |
| Minimum | 0.88% | 5.7% |
| Maximum | 70.0% | 41.7% |
| Range | 69.1% | 36.0% |
| Mean | 18.1% | 20.9% |
| Median | 12.8% | 18.6% |
| Interquartile 25% (IQ1) | 10.3% | 9.8% |
| Interquartile 75% (IQ3) | 19.6% | 33.5% |
| Interquartile Range (IQR) | 9.2% | 23.7% |
| Standard Deviation (Sample) | 14.2% | 12.7% |
| Standard Deviation (Population) | 14.1% | 12.2% |
Similar Demographics by Unemployment Among Ages 20 to 24 years
Demographics Similar to Cajuns by Unemployment Among Ages 20 to 24 years
In terms of unemployment among ages 20 to 24 years, the demographic groups most similar to Cajuns are Blackfeet (12.0%, a difference of 0.010%), Immigrants from Armenia (12.0%, a difference of 0.030%), Immigrants from Belize (12.0%, a difference of 0.21%), Immigrants from Ghana (11.9%, a difference of 0.24%), and Immigrants from Senegal (11.9%, a difference of 0.47%).
| Demographics | Rating | Rank | Unemployment Among Ages 20 to 24 years |
| Belizeans | 0.0 /100 | #289 | Tragic 11.8% |
| Immigrants | Caribbean | 0.0 /100 | #290 | Tragic 11.8% |
| Central American Indians | 0.0 /100 | #291 | Tragic 11.9% |
| Immigrants | Senegal | 0.0 /100 | #292 | Tragic 11.9% |
| Immigrants | Ghana | 0.0 /100 | #293 | Tragic 11.9% |
| Immigrants | Belize | 0.0 /100 | #294 | Tragic 12.0% |
| Immigrants | Armenia | 0.0 /100 | #295 | Tragic 12.0% |
| Cajuns | 0.0 /100 | #296 | Tragic 12.0% |
| Blackfeet | 0.0 /100 | #297 | Tragic 12.0% |
| Lumbee | 0.0 /100 | #298 | Tragic 12.0% |
| Apache | 0.0 /100 | #299 | Tragic 12.0% |
| Spanish American Indians | 0.0 /100 | #300 | Tragic 12.1% |
| Immigrants | Sierra Leone | 0.0 /100 | #301 | Tragic 12.1% |
| Immigrants | Cabo Verde | 0.0 /100 | #302 | Tragic 12.2% |
| Haitians | 0.0 /100 | #303 | Tragic 12.2% |
Demographics Similar to Tsimshian by Unemployment Among Ages 20 to 24 years
In terms of unemployment among ages 20 to 24 years, the demographic groups most similar to Tsimshian are Crow (18.7%, a difference of 4.2%), Puerto Rican (16.7%, a difference of 8.0%), Hopi (19.9%, a difference of 10.6%), Navajo (16.1%, a difference of 11.4%), and Yuman (15.8%, a difference of 13.5%).
| Demographics | Rating | Rank | Unemployment Among Ages 20 to 24 years |
| Immigrants | Guyana | 0.0 /100 | #333 | Tragic 13.9% |
| Guyanese | 0.0 /100 | #334 | Tragic 14.0% |
| Sioux | 0.0 /100 | #335 | Tragic 14.2% |
| Pima | 0.0 /100 | #336 | Tragic 14.2% |
| Paiute | 0.0 /100 | #337 | Tragic 14.3% |
| Immigrants | St. Vincent and the Grenadines | 0.0 /100 | #338 | Tragic 14.3% |
| Immigrants | Yemen | 0.0 /100 | #339 | Tragic 14.9% |
| Yuman | 0.0 /100 | #340 | Tragic 15.8% |
| Navajo | 0.0 /100 | #341 | Tragic 16.1% |
| Puerto Ricans | 0.0 /100 | #342 | Tragic 16.7% |
| Tsimshian | 0.0 /100 | #343 | Tragic 18.0% |
| Crow | 0.0 /100 | #344 | Tragic 18.7% |
| Hopi | 0.0 /100 | #345 | Tragic 19.9% |
| Yup'ik | 0.0 /100 | #346 | Tragic 20.9% |
| Inupiat | 0.0 /100 | #347 | Tragic 20.9% |