Cajun vs Yup'ik Female Unemployment
COMPARE
Cajun
Yup'ik
Female Unemployment
Female Unemployment Comparison
Cajuns
Yup'ik
5.7%
FEMALE UNEMPLOYMENT
0.7/ 100
METRIC RATING
252nd/ 347
METRIC RANK
10.9%
FEMALE UNEMPLOYMENT
0.0/ 100
METRIC RATING
346th/ 347
METRIC RANK
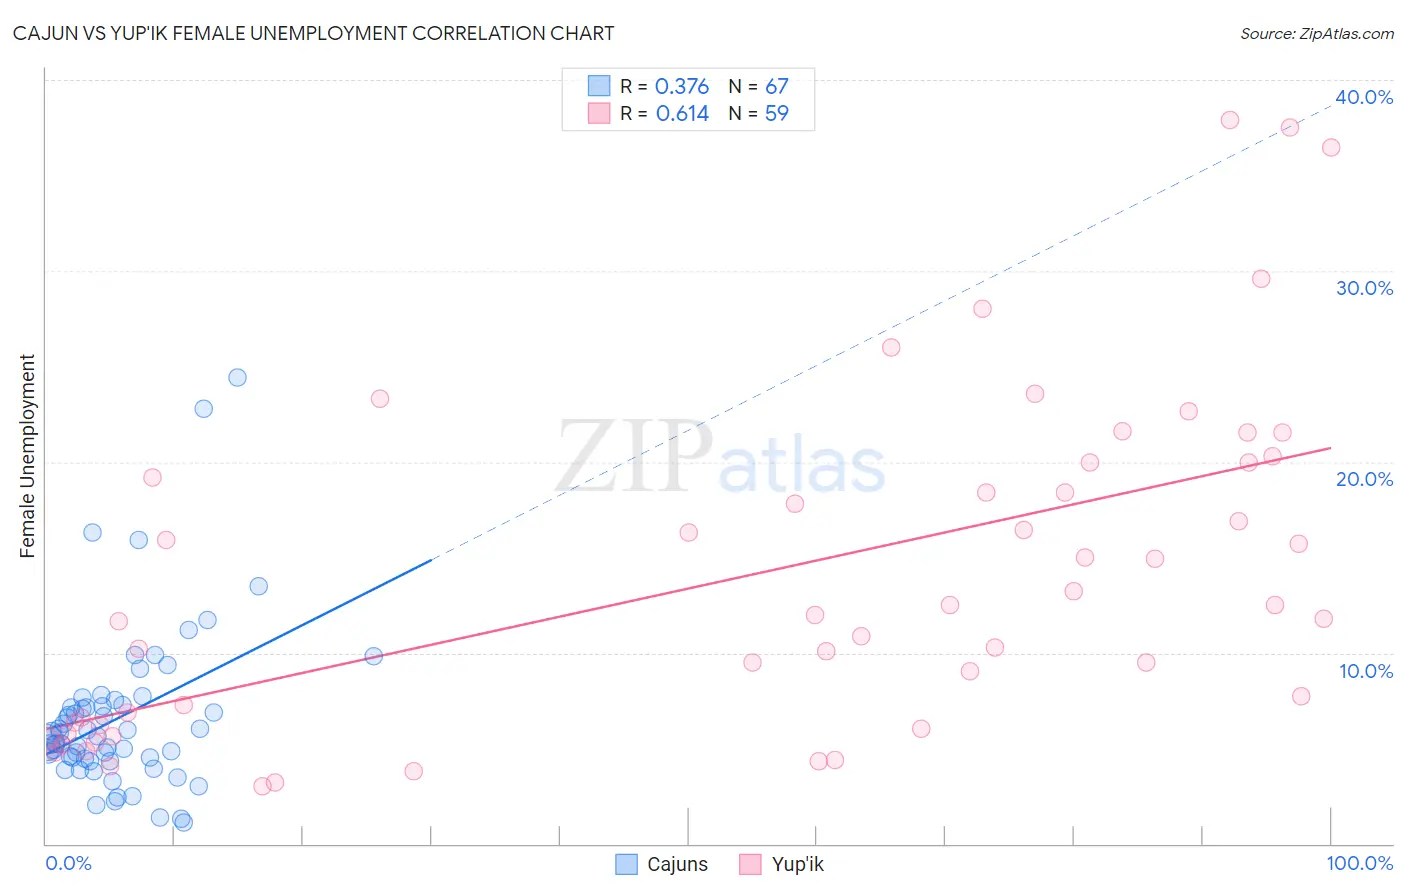
Cajun vs Yup'ik Female Unemployment Correlation Chart
The statistical analysis conducted on geographies consisting of 149,152,884 people shows a mild positive correlation between the proportion of Cajuns and unemploymnet rate among females in the United States with a correlation coefficient (R) of 0.376 and weighted average of 5.7%. Similarly, the statistical analysis conducted on geographies consisting of 39,915,126 people shows a significant positive correlation between the proportion of Yup'ik and unemploymnet rate among females in the United States with a correlation coefficient (R) of 0.614 and weighted average of 10.9%, a difference of 92.3%.
Female Unemployment Correlation Summary
| Measurement | Cajun | Yup'ik |
| Minimum | 1.1% | 3.0% |
| Maximum | 24.4% | 37.9% |
| Range | 23.3% | 34.9% |
| Mean | 6.6% | 14.0% |
| Median | 5.6% | 12.0% |
| Interquartile 25% (IQ1) | 4.4% | 6.2% |
| Interquartile 75% (IQ3) | 7.3% | 20.0% |
| Interquartile Range (IQR) | 2.8% | 13.8% |
| Standard Deviation (Sample) | 4.3% | 8.8% |
| Standard Deviation (Population) | 4.2% | 8.8% |
Similar Demographics by Female Unemployment
Demographics Similar to Cajuns by Female Unemployment
In terms of female unemployment, the demographic groups most similar to Cajuns are Immigrants from Sierra Leone (5.7%, a difference of 0.15%), Immigrants (5.7%, a difference of 0.15%), Immigrants from Cameroon (5.7%, a difference of 0.18%), Assyrian/Chaldean/Syriac (5.6%, a difference of 0.20%), and Immigrants from Syria (5.6%, a difference of 0.26%).
| Demographics | Rating | Rank | Female Unemployment |
| Guamanians/Chamorros | 1.4 /100 | #245 | Tragic 5.6% |
| Japanese | 1.2 /100 | #246 | Tragic 5.6% |
| Immigrants | Western Asia | 1.1 /100 | #247 | Tragic 5.6% |
| Cree | 1.0 /100 | #248 | Tragic 5.6% |
| Immigrants | Uzbekistan | 1.0 /100 | #249 | Tragic 5.6% |
| Immigrants | Syria | 0.8 /100 | #250 | Tragic 5.6% |
| Assyrians/Chaldeans/Syriacs | 0.8 /100 | #251 | Tragic 5.6% |
| Cajuns | 0.7 /100 | #252 | Tragic 5.7% |
| Immigrants | Sierra Leone | 0.6 /100 | #253 | Tragic 5.7% |
| Immigrants | Immigrants | 0.6 /100 | #254 | Tragic 5.7% |
| Immigrants | Cameroon | 0.6 /100 | #255 | Tragic 5.7% |
| Sub-Saharan Africans | 0.4 /100 | #256 | Tragic 5.7% |
| Dutch West Indians | 0.3 /100 | #257 | Tragic 5.7% |
| Immigrants | Portugal | 0.2 /100 | #258 | Tragic 5.8% |
| Immigrants | Fiji | 0.2 /100 | #259 | Tragic 5.8% |
Demographics Similar to Yup'ik by Female Unemployment
In terms of female unemployment, the demographic groups most similar to Yup'ik are Crow (12.1%, a difference of 11.5%), Yuman (9.6%, a difference of 13.4%), Pima (9.3%, a difference of 16.5%), Arapaho (8.8%, a difference of 23.7%), and Puerto Rican (8.3%, a difference of 30.4%).
| Demographics | Rating | Rank | Female Unemployment |
| Menominee | 0.0 /100 | #333 | Tragic 7.0% |
| Immigrants | Armenia | 0.0 /100 | #334 | Tragic 7.1% |
| Dominicans | 0.0 /100 | #335 | Tragic 7.2% |
| Immigrants | Dominican Republic | 0.0 /100 | #336 | Tragic 7.2% |
| Navajo | 0.0 /100 | #337 | Tragic 7.3% |
| Tohono O'odham | 0.0 /100 | #338 | Tragic 7.7% |
| Immigrants | Yemen | 0.0 /100 | #339 | Tragic 7.8% |
| Hopi | 0.0 /100 | #340 | Tragic 8.1% |
| Inupiat | 0.0 /100 | #341 | Tragic 8.2% |
| Puerto Ricans | 0.0 /100 | #342 | Tragic 8.3% |
| Arapaho | 0.0 /100 | #343 | Tragic 8.8% |
| Pima | 0.0 /100 | #344 | Tragic 9.3% |
| Yuman | 0.0 /100 | #345 | Tragic 9.6% |
| Yup'ik | 0.0 /100 | #346 | Tragic 10.9% |
| Crow | 0.0 /100 | #347 | Tragic 12.1% |