Somali vs Immigrants from Western Europe Unemployment Among Youth under 25 years
COMPARE
Somali
Immigrants from Western Europe
Unemployment Among Youth under 25 years
Unemployment Among Youth under 25 years Comparison
Somalis
Immigrants from Western Europe
10.7%
UNEMPLOYMENT AMONG YOUTH UNDER 25 YEARS
100.0/ 100
METRIC RATING
28th/ 347
METRIC RANK
11.5%
UNEMPLOYMENT AMONG YOUTH UNDER 25 YEARS
64.7/ 100
METRIC RATING
159th/ 347
METRIC RANK
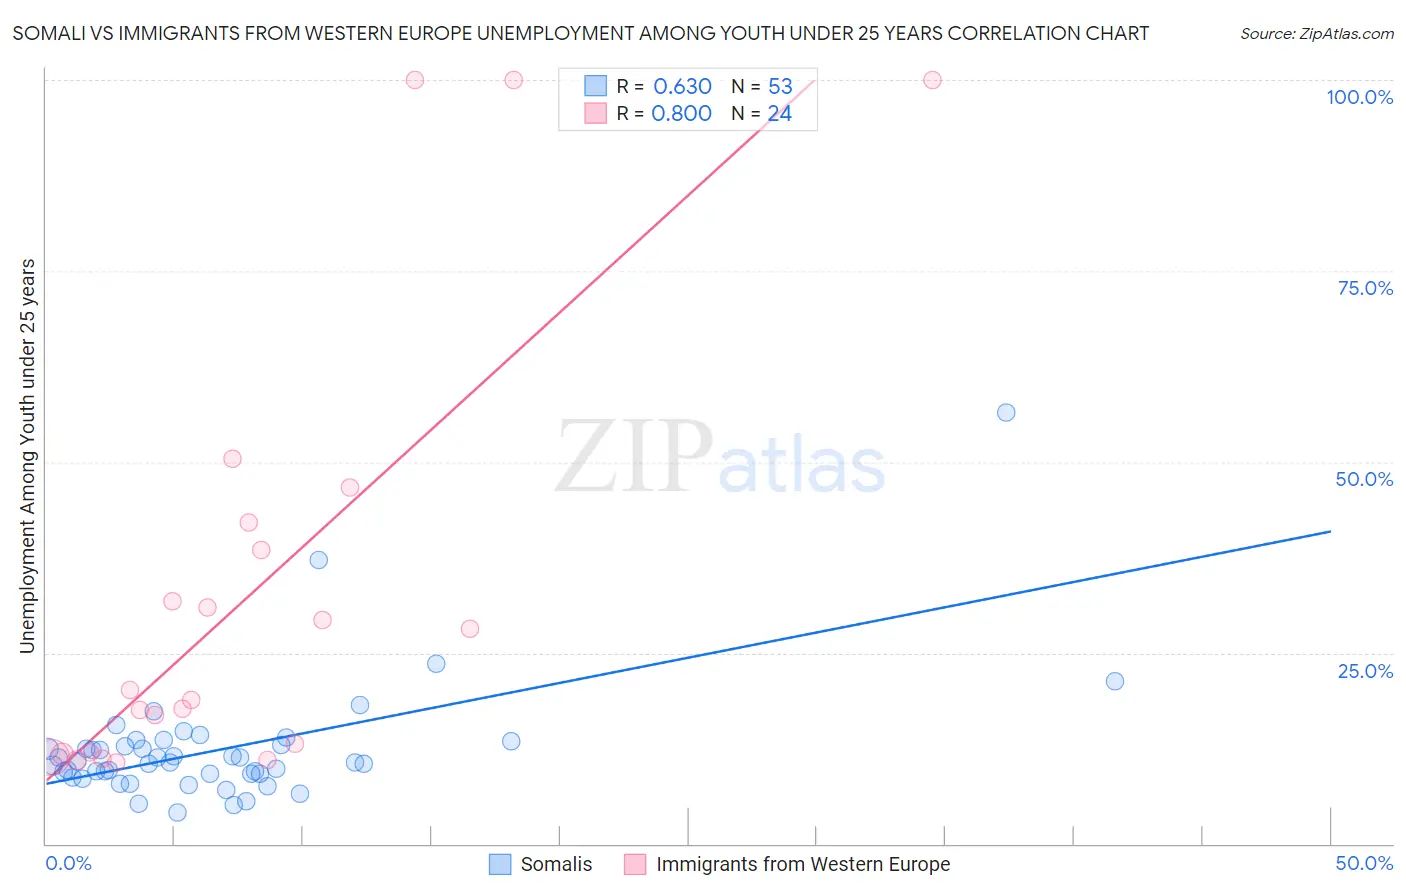
Somali vs Immigrants from Western Europe Unemployment Among Youth under 25 years Correlation Chart
The statistical analysis conducted on geographies consisting of 99,064,920 people shows a significant positive correlation between the proportion of Somalis and unemployment rate among youth under the age of 25 in the United States with a correlation coefficient (R) of 0.630 and weighted average of 10.7%. Similarly, the statistical analysis conducted on geographies consisting of 482,819,626 people shows a very strong positive correlation between the proportion of Immigrants from Western Europe and unemployment rate among youth under the age of 25 in the United States with a correlation coefficient (R) of 0.800 and weighted average of 11.5%, a difference of 8.1%.
Unemployment Among Youth under 25 years Correlation Summary
| Measurement | Somali | Immigrants from Western Europe |
| Minimum | 4.0% | 10.7% |
| Maximum | 56.4% | 100.0% |
| Range | 52.4% | 89.3% |
| Mean | 12.4% | 32.5% |
| Median | 10.6% | 19.4% |
| Interquartile 25% (IQ1) | 9.1% | 11.9% |
| Interquartile 75% (IQ3) | 13.2% | 40.3% |
| Interquartile Range (IQR) | 4.1% | 28.4% |
| Standard Deviation (Sample) | 8.0% | 28.7% |
| Standard Deviation (Population) | 7.9% | 28.1% |
Similar Demographics by Unemployment Among Youth under 25 years
Demographics Similar to Somalis by Unemployment Among Youth under 25 years
In terms of unemployment among youth under 25 years, the demographic groups most similar to Somalis are Yugoslavian (10.7%, a difference of 0.040%), Immigrants from India (10.7%, a difference of 0.060%), Finnish (10.7%, a difference of 0.15%), Immigrants from North Macedonia (10.7%, a difference of 0.15%), and Chinese (10.7%, a difference of 0.34%).
| Demographics | Rating | Rank | Unemployment Among Youth under 25 years |
| Pennsylvania Germans | 100.0 /100 | #21 | Exceptional 10.6% |
| Belgians | 100.0 /100 | #22 | Exceptional 10.6% |
| Immigrants | Bosnia and Herzegovina | 100.0 /100 | #23 | Exceptional 10.6% |
| Finns | 100.0 /100 | #24 | Exceptional 10.7% |
| Immigrants | North Macedonia | 100.0 /100 | #25 | Exceptional 10.7% |
| Immigrants | India | 100.0 /100 | #26 | Exceptional 10.7% |
| Yugoslavians | 100.0 /100 | #27 | Exceptional 10.7% |
| Somalis | 100.0 /100 | #28 | Exceptional 10.7% |
| Chinese | 99.9 /100 | #29 | Exceptional 10.7% |
| Osage | 99.9 /100 | #30 | Exceptional 10.7% |
| Slovenes | 99.9 /100 | #31 | Exceptional 10.7% |
| Taiwanese | 99.9 /100 | #32 | Exceptional 10.8% |
| Europeans | 99.9 /100 | #33 | Exceptional 10.8% |
| English | 99.9 /100 | #34 | Exceptional 10.8% |
| Immigrants | Nepal | 99.9 /100 | #35 | Exceptional 10.8% |
Demographics Similar to Immigrants from Western Europe by Unemployment Among Youth under 25 years
In terms of unemployment among youth under 25 years, the demographic groups most similar to Immigrants from Western Europe are Immigrants from Turkey (11.5%, a difference of 0.0%), Immigrants from Eastern Asia (11.5%, a difference of 0.010%), Indian (Asian) (11.5%, a difference of 0.020%), Ukrainian (11.5%, a difference of 0.020%), and Immigrants from Germany (11.5%, a difference of 0.050%).
| Demographics | Rating | Rank | Unemployment Among Youth under 25 years |
| Iraqis | 68.3 /100 | #152 | Good 11.5% |
| Immigrants | Czechoslovakia | 67.1 /100 | #153 | Good 11.5% |
| Immigrants | Asia | 66.7 /100 | #154 | Good 11.5% |
| Immigrants | Romania | 66.3 /100 | #155 | Good 11.5% |
| Immigrants | Germany | 65.9 /100 | #156 | Good 11.5% |
| Indians (Asian) | 65.1 /100 | #157 | Good 11.5% |
| Immigrants | Turkey | 64.8 /100 | #158 | Good 11.5% |
| Immigrants | Western Europe | 64.7 /100 | #159 | Good 11.5% |
| Immigrants | Eastern Asia | 64.5 /100 | #160 | Good 11.5% |
| Ukrainians | 64.3 /100 | #161 | Good 11.5% |
| Immigrants | Northern Africa | 62.7 /100 | #162 | Good 11.5% |
| Immigrants | Kazakhstan | 62.7 /100 | #163 | Good 11.5% |
| Immigrants | Laos | 62.4 /100 | #164 | Good 11.5% |
| Immigrants | Sweden | 61.3 /100 | #165 | Good 11.5% |
| Spanish | 60.3 /100 | #166 | Good 11.6% |