Brazilian vs Vietnamese Unemployment Among Women with Children Under 6 years
COMPARE
Brazilian
Vietnamese
Unemployment Among Women with Children Under 6 years
Unemployment Among Women with Children Under 6 years Comparison
Brazilians
Vietnamese
7.7%
UNEMPLOYMENT AMONG WOMEN WITH CHILDREN UNDER 6 YEARS
43.9/ 100
METRIC RATING
181st/ 347
METRIC RANK
8.8%
UNEMPLOYMENT AMONG WOMEN WITH CHILDREN UNDER 6 YEARS
0.0/ 100
METRIC RATING
290th/ 347
METRIC RANK
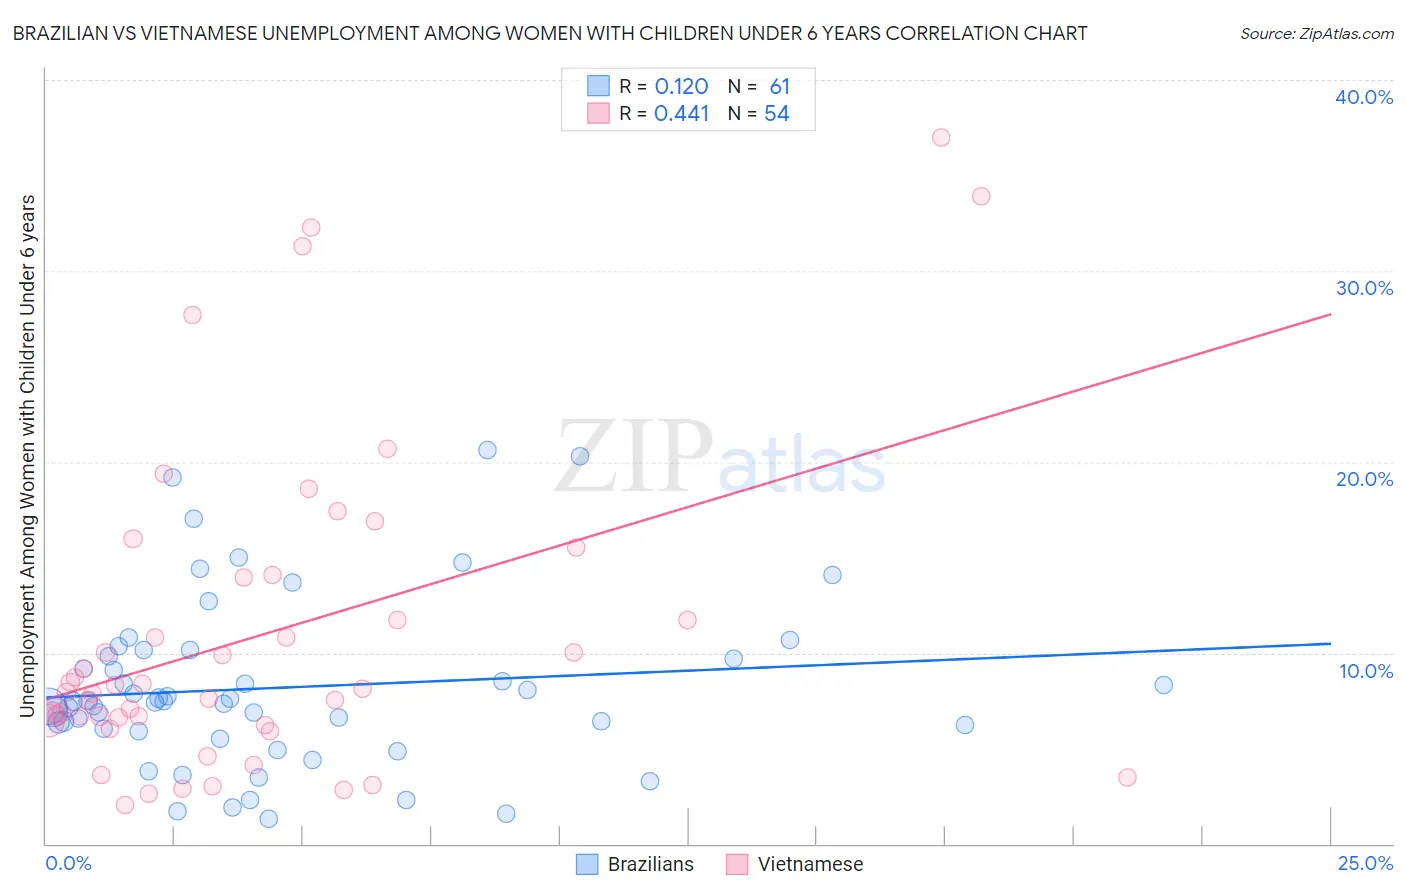
Brazilian vs Vietnamese Unemployment Among Women with Children Under 6 years Correlation Chart
The statistical analysis conducted on geographies consisting of 256,263,752 people shows a poor positive correlation between the proportion of Brazilians and unemployment rate among women with children under the age of 6 in the United States with a correlation coefficient (R) of 0.120 and weighted average of 7.7%. Similarly, the statistical analysis conducted on geographies consisting of 149,129,417 people shows a moderate positive correlation between the proportion of Vietnamese and unemployment rate among women with children under the age of 6 in the United States with a correlation coefficient (R) of 0.441 and weighted average of 8.8%, a difference of 14.0%.
Unemployment Among Women with Children Under 6 years Correlation Summary
| Measurement | Brazilian | Vietnamese |
| Minimum | 1.3% | 2.0% |
| Maximum | 20.6% | 37.0% |
| Range | 19.3% | 35.0% |
| Mean | 8.2% | 10.9% |
| Median | 7.5% | 8.0% |
| Interquartile 25% (IQ1) | 6.0% | 6.5% |
| Interquartile 75% (IQ3) | 10.0% | 13.9% |
| Interquartile Range (IQR) | 4.0% | 7.5% |
| Standard Deviation (Sample) | 4.4% | 8.3% |
| Standard Deviation (Population) | 4.4% | 8.2% |
Similar Demographics by Unemployment Among Women with Children Under 6 years
Demographics Similar to Brazilians by Unemployment Among Women with Children Under 6 years
In terms of unemployment among women with children under 6 years, the demographic groups most similar to Brazilians are Nepalese (7.7%, a difference of 0.020%), Immigrants from Uruguay (7.7%, a difference of 0.040%), Immigrants from Western Europe (7.7%, a difference of 0.070%), Sierra Leonean (7.7%, a difference of 0.070%), and Immigrants from England (7.7%, a difference of 0.10%).
| Demographics | Rating | Rank | Unemployment Among Women with Children Under 6 years |
| Immigrants | Laos | 50.0 /100 | #174 | Average 7.6% |
| Panamanians | 49.6 /100 | #175 | Average 7.6% |
| Puget Sound Salish | 47.7 /100 | #176 | Average 7.7% |
| Austrians | 46.0 /100 | #177 | Average 7.7% |
| Immigrants | England | 45.4 /100 | #178 | Average 7.7% |
| Immigrants | Western Europe | 44.9 /100 | #179 | Average 7.7% |
| Immigrants | Uruguay | 44.5 /100 | #180 | Average 7.7% |
| Brazilians | 43.9 /100 | #181 | Average 7.7% |
| Nepalese | 43.5 /100 | #182 | Average 7.7% |
| Sierra Leoneans | 42.9 /100 | #183 | Average 7.7% |
| Indonesians | 40.5 /100 | #184 | Average 7.7% |
| Spanish Americans | 39.7 /100 | #185 | Fair 7.7% |
| Yugoslavians | 39.4 /100 | #186 | Fair 7.7% |
| Immigrants | Thailand | 38.5 /100 | #187 | Fair 7.7% |
| Czechoslovakians | 38.4 /100 | #188 | Fair 7.7% |
Demographics Similar to Vietnamese by Unemployment Among Women with Children Under 6 years
In terms of unemployment among women with children under 6 years, the demographic groups most similar to Vietnamese are Iroquois (8.7%, a difference of 0.15%), Bahamian (8.7%, a difference of 0.26%), Jamaican (8.8%, a difference of 0.44%), Menominee (8.7%, a difference of 0.46%), and U.S. Virgin Islander (8.7%, a difference of 0.61%).
| Demographics | Rating | Rank | Unemployment Among Women with Children Under 6 years |
| Spanish American Indians | 0.0 /100 | #283 | Tragic 8.7% |
| Blackfeet | 0.0 /100 | #284 | Tragic 8.7% |
| U.S. Virgin Islanders | 0.0 /100 | #285 | Tragic 8.7% |
| Seminole | 0.0 /100 | #286 | Tragic 8.7% |
| Menominee | 0.0 /100 | #287 | Tragic 8.7% |
| Bahamians | 0.0 /100 | #288 | Tragic 8.7% |
| Iroquois | 0.0 /100 | #289 | Tragic 8.7% |
| Vietnamese | 0.0 /100 | #290 | Tragic 8.8% |
| Jamaicans | 0.0 /100 | #291 | Tragic 8.8% |
| Cheyenne | 0.0 /100 | #292 | Tragic 8.8% |
| Immigrants | Bangladesh | 0.0 /100 | #293 | Tragic 8.8% |
| Immigrants | Nonimmigrants | 0.0 /100 | #294 | Tragic 8.8% |
| Immigrants | Central America | 0.0 /100 | #295 | Tragic 8.9% |
| Immigrants | Dominican Republic | 0.0 /100 | #296 | Tragic 8.9% |
| Mexicans | 0.0 /100 | #297 | Tragic 8.9% |