South African vs Vietnamese Unemployment Among Women with Children Under 6 years
COMPARE
South African
Vietnamese
Unemployment Among Women with Children Under 6 years
Unemployment Among Women with Children Under 6 years Comparison
South Africans
Vietnamese
7.3%
UNEMPLOYMENT AMONG WOMEN WITH CHILDREN UNDER 6 YEARS
94.1/ 100
METRIC RATING
119th/ 347
METRIC RANK
8.8%
UNEMPLOYMENT AMONG WOMEN WITH CHILDREN UNDER 6 YEARS
0.0/ 100
METRIC RATING
290th/ 347
METRIC RANK
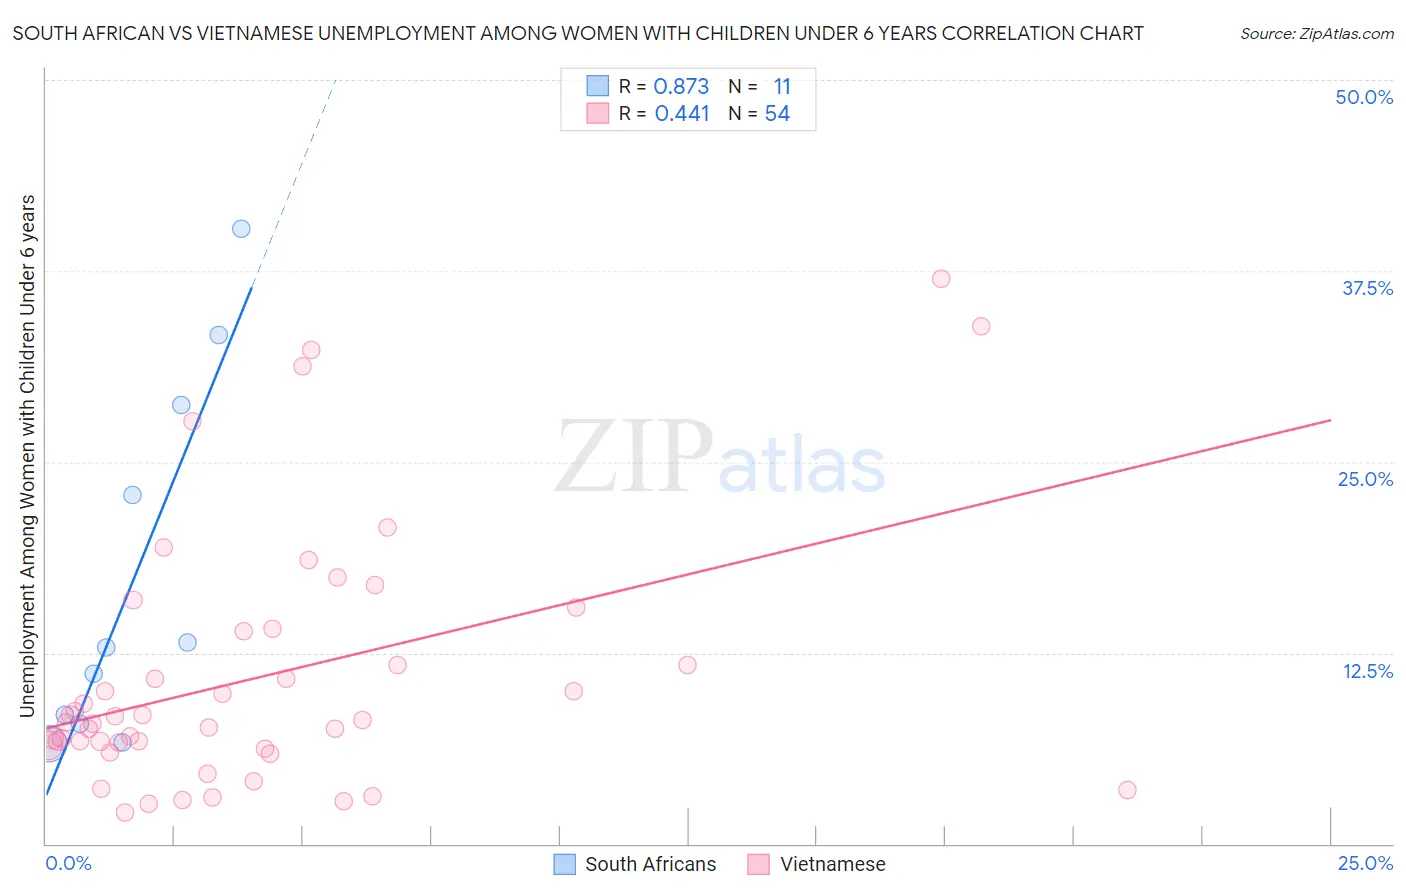
South African vs Vietnamese Unemployment Among Women with Children Under 6 years Correlation Chart
The statistical analysis conducted on geographies consisting of 153,714,880 people shows a very strong positive correlation between the proportion of South Africans and unemployment rate among women with children under the age of 6 in the United States with a correlation coefficient (R) of 0.873 and weighted average of 7.3%. Similarly, the statistical analysis conducted on geographies consisting of 149,129,417 people shows a moderate positive correlation between the proportion of Vietnamese and unemployment rate among women with children under the age of 6 in the United States with a correlation coefficient (R) of 0.441 and weighted average of 8.8%, a difference of 20.0%.
Unemployment Among Women with Children Under 6 years Correlation Summary
| Measurement | South African | Vietnamese |
| Minimum | 6.6% | 2.0% |
| Maximum | 40.3% | 37.0% |
| Range | 33.7% | 35.0% |
| Mean | 17.4% | 10.9% |
| Median | 12.8% | 8.0% |
| Interquartile 25% (IQ1) | 7.9% | 6.5% |
| Interquartile 75% (IQ3) | 28.7% | 13.9% |
| Interquartile Range (IQR) | 20.8% | 7.5% |
| Standard Deviation (Sample) | 11.9% | 8.3% |
| Standard Deviation (Population) | 11.3% | 8.2% |
Similar Demographics by Unemployment Among Women with Children Under 6 years
Demographics Similar to South Africans by Unemployment Among Women with Children Under 6 years
In terms of unemployment among women with children under 6 years, the demographic groups most similar to South Africans are Iraqi (7.3%, a difference of 0.070%), Serbian (7.3%, a difference of 0.11%), Immigrants from Chile (7.3%, a difference of 0.19%), Immigrants from Bosnia and Herzegovina (7.3%, a difference of 0.20%), and Immigrants from Zaire (7.3%, a difference of 0.25%).
| Demographics | Rating | Rank | Unemployment Among Women with Children Under 6 years |
| Israelis | 96.5 /100 | #112 | Exceptional 7.2% |
| Nicaraguans | 96.3 /100 | #113 | Exceptional 7.2% |
| Argentineans | 96.2 /100 | #114 | Exceptional 7.2% |
| Immigrants | Italy | 96.1 /100 | #115 | Exceptional 7.2% |
| Armenians | 95.9 /100 | #116 | Exceptional 7.2% |
| Immigrants | Kenya | 95.4 /100 | #117 | Exceptional 7.3% |
| Serbians | 94.5 /100 | #118 | Exceptional 7.3% |
| South Africans | 94.1 /100 | #119 | Exceptional 7.3% |
| Iraqis | 93.9 /100 | #120 | Exceptional 7.3% |
| Immigrants | Chile | 93.5 /100 | #121 | Exceptional 7.3% |
| Immigrants | Bosnia and Herzegovina | 93.5 /100 | #122 | Exceptional 7.3% |
| Immigrants | Zaire | 93.3 /100 | #123 | Exceptional 7.3% |
| Immigrants | South Africa | 92.5 /100 | #124 | Exceptional 7.3% |
| Pakistanis | 92.2 /100 | #125 | Exceptional 7.3% |
| Immigrants | Burma/Myanmar | 91.9 /100 | #126 | Exceptional 7.3% |
Demographics Similar to Vietnamese by Unemployment Among Women with Children Under 6 years
In terms of unemployment among women with children under 6 years, the demographic groups most similar to Vietnamese are Iroquois (8.7%, a difference of 0.15%), Bahamian (8.7%, a difference of 0.26%), Jamaican (8.8%, a difference of 0.44%), Menominee (8.7%, a difference of 0.46%), and U.S. Virgin Islander (8.7%, a difference of 0.61%).
| Demographics | Rating | Rank | Unemployment Among Women with Children Under 6 years |
| Spanish American Indians | 0.0 /100 | #283 | Tragic 8.7% |
| Blackfeet | 0.0 /100 | #284 | Tragic 8.7% |
| U.S. Virgin Islanders | 0.0 /100 | #285 | Tragic 8.7% |
| Seminole | 0.0 /100 | #286 | Tragic 8.7% |
| Menominee | 0.0 /100 | #287 | Tragic 8.7% |
| Bahamians | 0.0 /100 | #288 | Tragic 8.7% |
| Iroquois | 0.0 /100 | #289 | Tragic 8.7% |
| Vietnamese | 0.0 /100 | #290 | Tragic 8.8% |
| Jamaicans | 0.0 /100 | #291 | Tragic 8.8% |
| Cheyenne | 0.0 /100 | #292 | Tragic 8.8% |
| Immigrants | Bangladesh | 0.0 /100 | #293 | Tragic 8.8% |
| Immigrants | Nonimmigrants | 0.0 /100 | #294 | Tragic 8.8% |
| Immigrants | Central America | 0.0 /100 | #295 | Tragic 8.9% |
| Immigrants | Dominican Republic | 0.0 /100 | #296 | Tragic 8.9% |
| Mexicans | 0.0 /100 | #297 | Tragic 8.9% |