Israeli vs German Unemployment Among Ages 65 to 74 years
COMPARE
Israeli
German
Unemployment Among Ages 65 to 74 years
Unemployment Among Ages 65 to 74 years Comparison
Israelis
Germans
5.5%
UNEMPLOYMENT AMONG AGES 65 TO 74 YEARS
2.5/ 100
METRIC RATING
231st/ 347
METRIC RANK
5.1%
UNEMPLOYMENT AMONG AGES 65 TO 74 YEARS
99.5/ 100
METRIC RATING
58th/ 347
METRIC RANK
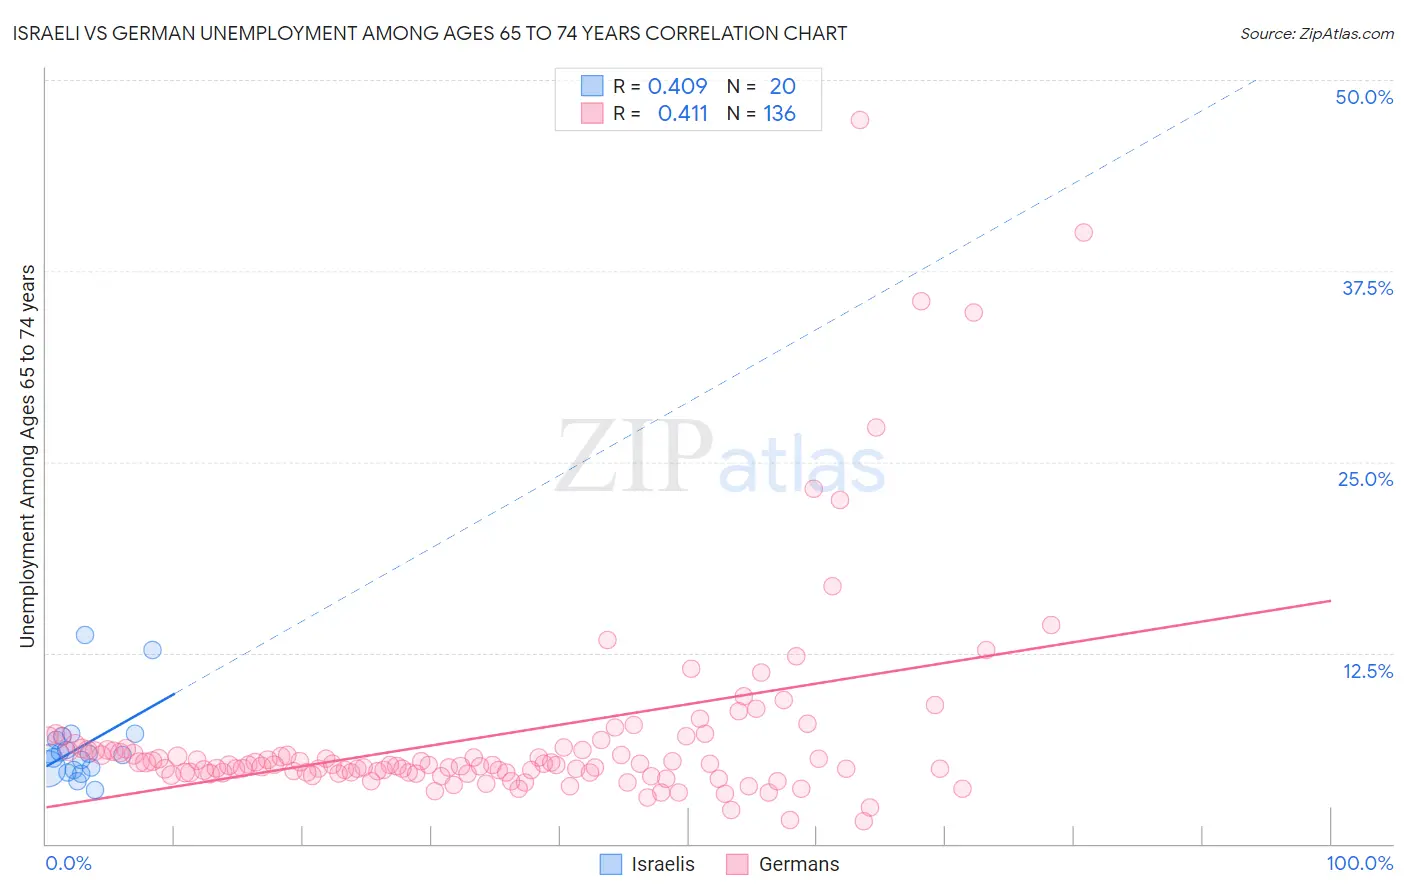
Israeli vs German Unemployment Among Ages 65 to 74 years Correlation Chart
The statistical analysis conducted on geographies consisting of 198,320,977 people shows a moderate positive correlation between the proportion of Israelis and unemployment rate among population between the ages 65 and 74 in the United States with a correlation coefficient (R) of 0.409 and weighted average of 5.5%. Similarly, the statistical analysis conducted on geographies consisting of 447,999,375 people shows a moderate positive correlation between the proportion of Germans and unemployment rate among population between the ages 65 and 74 in the United States with a correlation coefficient (R) of 0.411 and weighted average of 5.1%, a difference of 7.7%.
Unemployment Among Ages 65 to 74 years Correlation Summary
| Measurement | Israeli | German |
| Minimum | 3.5% | 1.5% |
| Maximum | 13.7% | 47.4% |
| Range | 10.2% | 45.9% |
| Mean | 6.3% | 7.0% |
| Median | 5.8% | 5.2% |
| Interquartile 25% (IQ1) | 4.9% | 4.6% |
| Interquartile 75% (IQ3) | 6.9% | 6.2% |
| Interquartile Range (IQR) | 2.0% | 1.5% |
| Standard Deviation (Sample) | 2.6% | 6.7% |
| Standard Deviation (Population) | 2.5% | 6.7% |
Similar Demographics by Unemployment Among Ages 65 to 74 years
Demographics Similar to Israelis by Unemployment Among Ages 65 to 74 years
In terms of unemployment among ages 65 to 74 years, the demographic groups most similar to Israelis are Nigerian (5.5%, a difference of 0.010%), Immigrants from Caribbean (5.5%, a difference of 0.040%), West Indian (5.5%, a difference of 0.060%), South American Indian (5.5%, a difference of 0.10%), and French American Indian (5.5%, a difference of 0.11%).
| Demographics | Rating | Rank | Unemployment Among Ages 65 to 74 years |
| Immigrants | Uruguay | 4.2 /100 | #224 | Tragic 5.5% |
| Immigrants | Trinidad and Tobago | 4.1 /100 | #225 | Tragic 5.5% |
| Hondurans | 3.7 /100 | #226 | Tragic 5.5% |
| Immigrants | Albania | 3.7 /100 | #227 | Tragic 5.5% |
| Immigrants | Israel | 3.0 /100 | #228 | Tragic 5.5% |
| West Indians | 2.7 /100 | #229 | Tragic 5.5% |
| Immigrants | Caribbean | 2.7 /100 | #230 | Tragic 5.5% |
| Israelis | 2.5 /100 | #231 | Tragic 5.5% |
| Nigerians | 2.5 /100 | #232 | Tragic 5.5% |
| South American Indians | 2.3 /100 | #233 | Tragic 5.5% |
| French American Indians | 2.2 /100 | #234 | Tragic 5.5% |
| Peruvians | 2.2 /100 | #235 | Tragic 5.5% |
| Hopi | 2.2 /100 | #236 | Tragic 5.5% |
| Immigrants | Belize | 2.2 /100 | #237 | Tragic 5.5% |
| Cajuns | 1.8 /100 | #238 | Tragic 5.5% |
Demographics Similar to Germans by Unemployment Among Ages 65 to 74 years
In terms of unemployment among ages 65 to 74 years, the demographic groups most similar to Germans are Swedish (5.1%, a difference of 0.050%), Croatian (5.1%, a difference of 0.050%), Immigrants from Bulgaria (5.1%, a difference of 0.050%), Immigrants from Jordan (5.1%, a difference of 0.10%), and Carpatho Rusyn (5.1%, a difference of 0.13%).
| Demographics | Rating | Rank | Unemployment Among Ages 65 to 74 years |
| Immigrants | Kazakhstan | 99.7 /100 | #51 | Exceptional 5.1% |
| Europeans | 99.6 /100 | #52 | Exceptional 5.1% |
| Immigrants | Ethiopia | 99.6 /100 | #53 | Exceptional 5.1% |
| Immigrants | Nicaragua | 99.6 /100 | #54 | Exceptional 5.1% |
| Carpatho Rusyns | 99.6 /100 | #55 | Exceptional 5.1% |
| Swedes | 99.5 /100 | #56 | Exceptional 5.1% |
| Croatians | 99.5 /100 | #57 | Exceptional 5.1% |
| Germans | 99.5 /100 | #58 | Exceptional 5.1% |
| Immigrants | Bulgaria | 99.4 /100 | #59 | Exceptional 5.1% |
| Immigrants | Jordan | 99.4 /100 | #60 | Exceptional 5.1% |
| Immigrants | Taiwan | 99.4 /100 | #61 | Exceptional 5.1% |
| Nicaraguans | 99.4 /100 | #62 | Exceptional 5.1% |
| Kiowa | 99.3 /100 | #63 | Exceptional 5.1% |
| Immigrants | Moldova | 99.3 /100 | #64 | Exceptional 5.1% |
| Bolivians | 99.3 /100 | #65 | Exceptional 5.1% |