Immigrants from Russia vs German Unemployment Among Ages 65 to 74 years
COMPARE
Immigrants from Russia
German
Unemployment Among Ages 65 to 74 years
Unemployment Among Ages 65 to 74 years Comparison
Immigrants from Russia
Germans
5.3%
UNEMPLOYMENT AMONG AGES 65 TO 74 YEARS
83.0/ 100
METRIC RATING
131st/ 347
METRIC RANK
5.1%
UNEMPLOYMENT AMONG AGES 65 TO 74 YEARS
99.5/ 100
METRIC RATING
58th/ 347
METRIC RANK
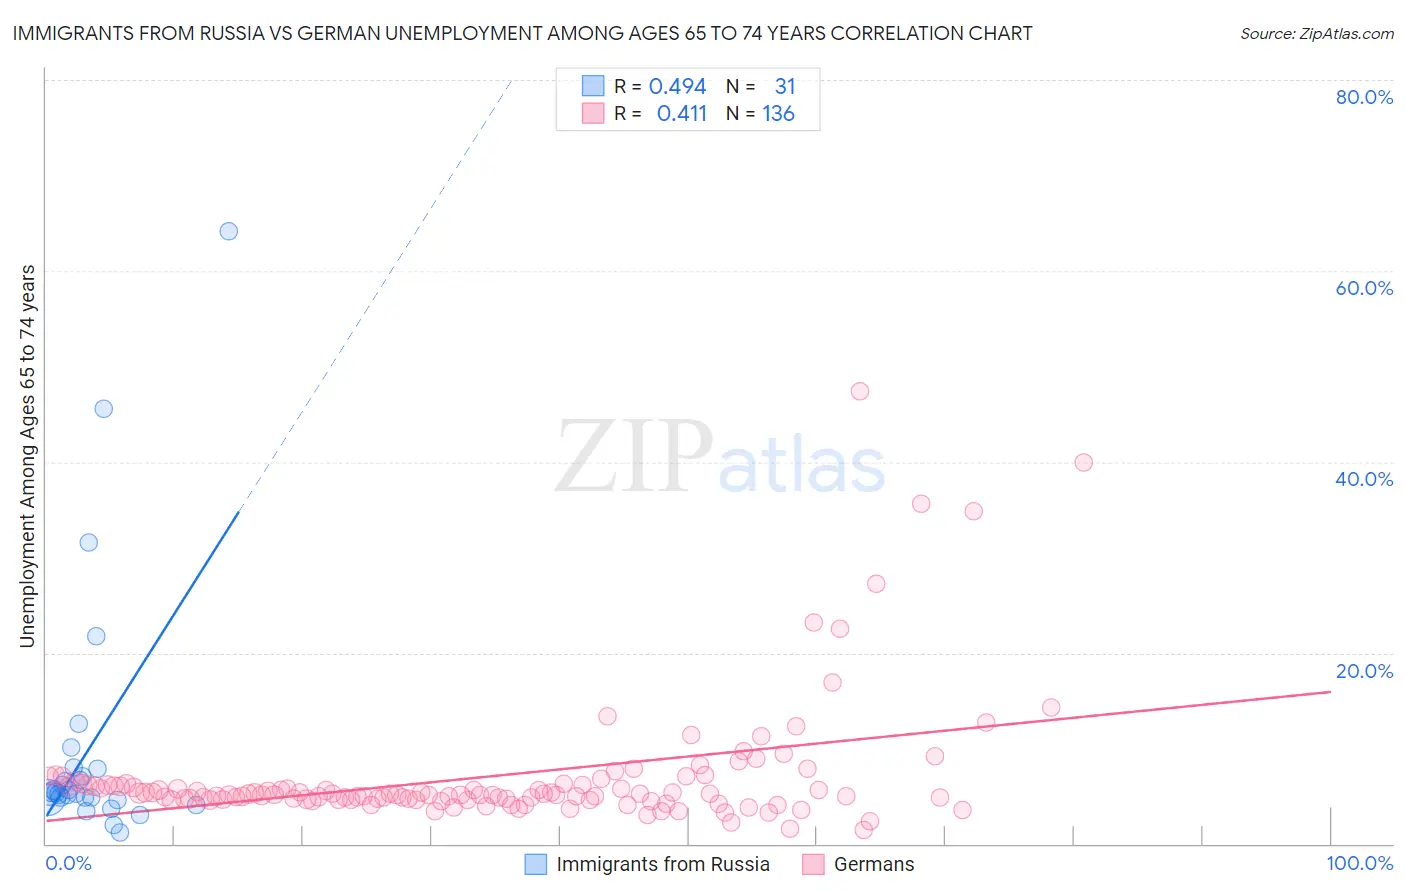
Immigrants from Russia vs German Unemployment Among Ages 65 to 74 years Correlation Chart
The statistical analysis conducted on geographies consisting of 312,358,328 people shows a moderate positive correlation between the proportion of Immigrants from Russia and unemployment rate among population between the ages 65 and 74 in the United States with a correlation coefficient (R) of 0.494 and weighted average of 5.3%. Similarly, the statistical analysis conducted on geographies consisting of 447,999,375 people shows a moderate positive correlation between the proportion of Germans and unemployment rate among population between the ages 65 and 74 in the United States with a correlation coefficient (R) of 0.411 and weighted average of 5.1%, a difference of 3.2%.
Unemployment Among Ages 65 to 74 years Correlation Summary
| Measurement | Immigrants from Russia | German |
| Minimum | 1.2% | 1.5% |
| Maximum | 64.1% | 47.4% |
| Range | 62.9% | 45.9% |
| Mean | 10.1% | 7.0% |
| Median | 5.4% | 5.2% |
| Interquartile 25% (IQ1) | 4.8% | 4.6% |
| Interquartile 75% (IQ3) | 7.8% | 6.2% |
| Interquartile Range (IQR) | 3.0% | 1.5% |
| Standard Deviation (Sample) | 13.5% | 6.7% |
| Standard Deviation (Population) | 13.3% | 6.7% |
Similar Demographics by Unemployment Among Ages 65 to 74 years
Demographics Similar to Immigrants from Russia by Unemployment Among Ages 65 to 74 years
In terms of unemployment among ages 65 to 74 years, the demographic groups most similar to Immigrants from Russia are Korean (5.3%, a difference of 0.020%), Ukrainian (5.3%, a difference of 0.060%), Immigrants from Panama (5.3%, a difference of 0.070%), Immigrants from Serbia (5.3%, a difference of 0.070%), and Celtic (5.3%, a difference of 0.12%).
| Demographics | Rating | Rank | Unemployment Among Ages 65 to 74 years |
| Immigrants | Ukraine | 87.5 /100 | #124 | Excellent 5.3% |
| Pakistanis | 87.5 /100 | #125 | Excellent 5.3% |
| Immigrants | South Eastern Asia | 87.2 /100 | #126 | Excellent 5.3% |
| Immigrants | North America | 86.7 /100 | #127 | Excellent 5.3% |
| Immigrants | Hong Kong | 86.5 /100 | #128 | Excellent 5.3% |
| Immigrants | England | 86.2 /100 | #129 | Excellent 5.3% |
| Eastern Europeans | 85.6 /100 | #130 | Excellent 5.3% |
| Immigrants | Russia | 83.0 /100 | #131 | Excellent 5.3% |
| Koreans | 82.6 /100 | #132 | Excellent 5.3% |
| Ukrainians | 82.0 /100 | #133 | Excellent 5.3% |
| Immigrants | Panama | 81.8 /100 | #134 | Excellent 5.3% |
| Immigrants | Serbia | 81.8 /100 | #135 | Excellent 5.3% |
| Celtics | 80.8 /100 | #136 | Excellent 5.3% |
| Immigrants | Afghanistan | 80.8 /100 | #137 | Excellent 5.3% |
| Chileans | 79.7 /100 | #138 | Good 5.3% |
Demographics Similar to Germans by Unemployment Among Ages 65 to 74 years
In terms of unemployment among ages 65 to 74 years, the demographic groups most similar to Germans are Swedish (5.1%, a difference of 0.050%), Croatian (5.1%, a difference of 0.050%), Immigrants from Bulgaria (5.1%, a difference of 0.050%), Immigrants from Jordan (5.1%, a difference of 0.10%), and Carpatho Rusyn (5.1%, a difference of 0.13%).
| Demographics | Rating | Rank | Unemployment Among Ages 65 to 74 years |
| Immigrants | Kazakhstan | 99.7 /100 | #51 | Exceptional 5.1% |
| Europeans | 99.6 /100 | #52 | Exceptional 5.1% |
| Immigrants | Ethiopia | 99.6 /100 | #53 | Exceptional 5.1% |
| Immigrants | Nicaragua | 99.6 /100 | #54 | Exceptional 5.1% |
| Carpatho Rusyns | 99.6 /100 | #55 | Exceptional 5.1% |
| Swedes | 99.5 /100 | #56 | Exceptional 5.1% |
| Croatians | 99.5 /100 | #57 | Exceptional 5.1% |
| Germans | 99.5 /100 | #58 | Exceptional 5.1% |
| Immigrants | Bulgaria | 99.4 /100 | #59 | Exceptional 5.1% |
| Immigrants | Jordan | 99.4 /100 | #60 | Exceptional 5.1% |
| Immigrants | Taiwan | 99.4 /100 | #61 | Exceptional 5.1% |
| Nicaraguans | 99.4 /100 | #62 | Exceptional 5.1% |
| Kiowa | 99.3 /100 | #63 | Exceptional 5.1% |
| Immigrants | Moldova | 99.3 /100 | #64 | Exceptional 5.1% |
| Bolivians | 99.3 /100 | #65 | Exceptional 5.1% |