Brazilian vs Northern European Unemployment Among Ages 65 to 74 years
COMPARE
Brazilian
Northern European
Unemployment Among Ages 65 to 74 years
Unemployment Among Ages 65 to 74 years Comparison
Brazilians
Northern Europeans
5.6%
UNEMPLOYMENT AMONG AGES 65 TO 74 YEARS
0.5/ 100
METRIC RATING
251st/ 347
METRIC RANK
5.2%
UNEMPLOYMENT AMONG AGES 65 TO 74 YEARS
98.9/ 100
METRIC RATING
78th/ 347
METRIC RANK
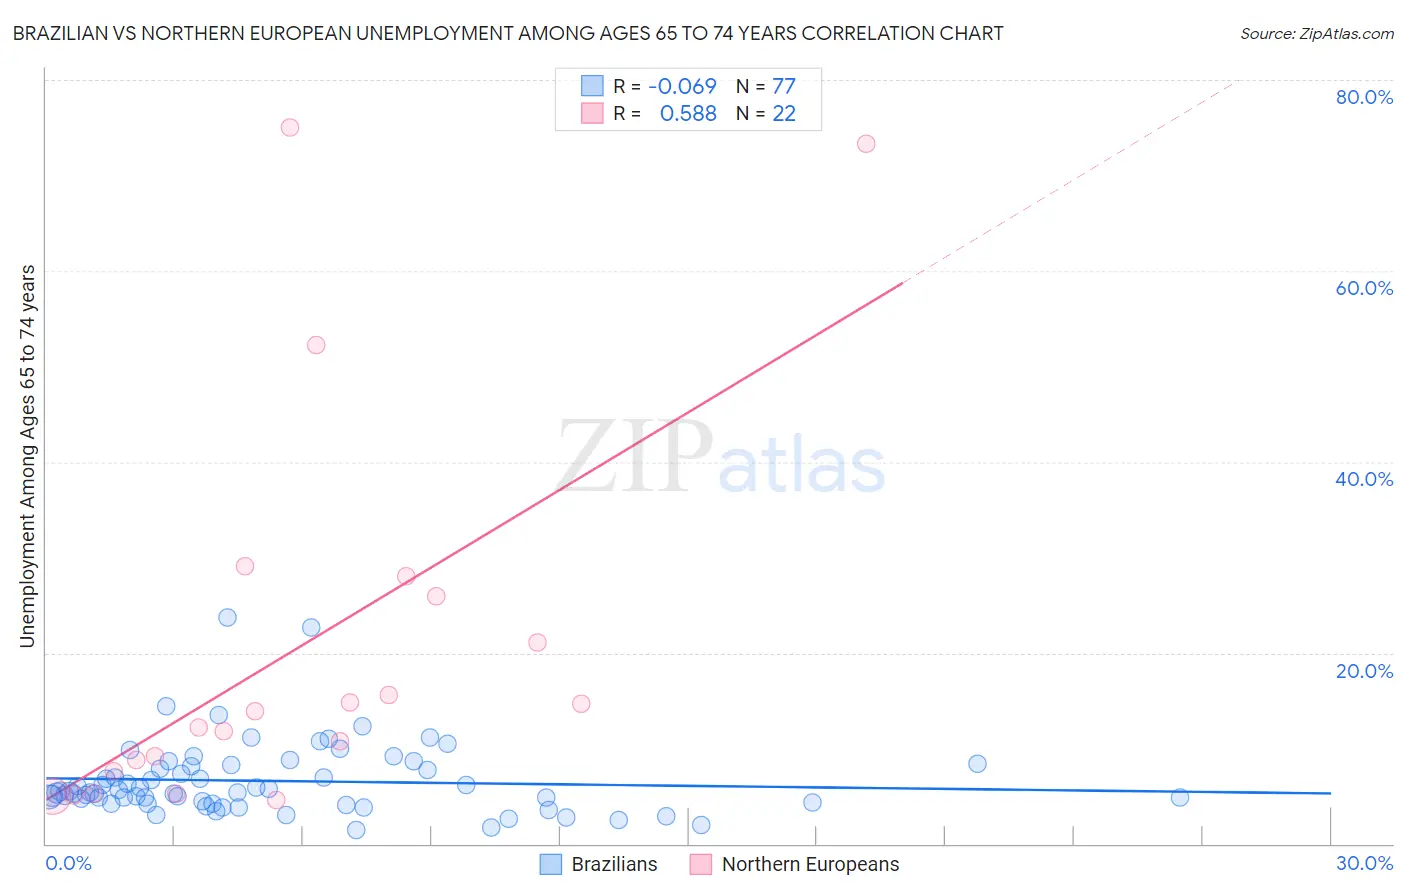
Brazilian vs Northern European Unemployment Among Ages 65 to 74 years Correlation Chart
The statistical analysis conducted on geographies consisting of 294,175,837 people shows a slight negative correlation between the proportion of Brazilians and unemployment rate among population between the ages 65 and 74 in the United States with a correlation coefficient (R) of -0.069 and weighted average of 5.6%. Similarly, the statistical analysis conducted on geographies consisting of 348,891,178 people shows a substantial positive correlation between the proportion of Northern Europeans and unemployment rate among population between the ages 65 and 74 in the United States with a correlation coefficient (R) of 0.588 and weighted average of 5.2%, a difference of 8.5%.
Unemployment Among Ages 65 to 74 years Correlation Summary
| Measurement | Brazilian | Northern European |
| Minimum | 1.5% | 4.6% |
| Maximum | 23.7% | 75.0% |
| Range | 22.2% | 70.4% |
| Mean | 6.6% | 20.4% |
| Median | 5.4% | 13.0% |
| Interquartile 25% (IQ1) | 4.3% | 7.6% |
| Interquartile 75% (IQ3) | 8.1% | 25.9% |
| Interquartile Range (IQR) | 3.9% | 18.3% |
| Standard Deviation (Sample) | 3.9% | 20.6% |
| Standard Deviation (Population) | 3.8% | 20.1% |
Similar Demographics by Unemployment Among Ages 65 to 74 years
Demographics Similar to Brazilians by Unemployment Among Ages 65 to 74 years
In terms of unemployment among ages 65 to 74 years, the demographic groups most similar to Brazilians are Colombian (5.6%, a difference of 0.040%), Immigrants from Brazil (5.6%, a difference of 0.10%), Immigrants from Costa Rica (5.6%, a difference of 0.12%), Immigrants from Haiti (5.6%, a difference of 0.21%), and Cape Verdean (5.6%, a difference of 0.26%).
| Demographics | Rating | Rank | Unemployment Among Ages 65 to 74 years |
| Immigrants | Micronesia | 0.9 /100 | #244 | Tragic 5.6% |
| Immigrants | Greece | 0.9 /100 | #245 | Tragic 5.6% |
| Paraguayans | 0.9 /100 | #246 | Tragic 5.6% |
| Immigrants | Immigrants | 0.9 /100 | #247 | Tragic 5.6% |
| Immigrants | Argentina | 0.9 /100 | #248 | Tragic 5.6% |
| Trinidadians and Tobagonians | 0.8 /100 | #249 | Tragic 5.6% |
| Cape Verdeans | 0.7 /100 | #250 | Tragic 5.6% |
| Brazilians | 0.5 /100 | #251 | Tragic 5.6% |
| Colombians | 0.5 /100 | #252 | Tragic 5.6% |
| Immigrants | Brazil | 0.5 /100 | #253 | Tragic 5.6% |
| Immigrants | Costa Rica | 0.5 /100 | #254 | Tragic 5.6% |
| Immigrants | Haiti | 0.4 /100 | #255 | Tragic 5.6% |
| Native Hawaiians | 0.4 /100 | #256 | Tragic 5.6% |
| Immigrants | Southern Europe | 0.3 /100 | #257 | Tragic 5.6% |
| Immigrants | Western Africa | 0.3 /100 | #258 | Tragic 5.6% |
Demographics Similar to Northern Europeans by Unemployment Among Ages 65 to 74 years
In terms of unemployment among ages 65 to 74 years, the demographic groups most similar to Northern Europeans are Immigrants from Sudan (5.2%, a difference of 0.010%), Okinawan (5.2%, a difference of 0.020%), Estonian (5.2%, a difference of 0.020%), Filipino (5.2%, a difference of 0.040%), and Afghan (5.2%, a difference of 0.040%).
| Demographics | Rating | Rank | Unemployment Among Ages 65 to 74 years |
| Scotch-Irish | 99.0 /100 | #71 | Exceptional 5.2% |
| Immigrants | Oceania | 99.0 /100 | #72 | Exceptional 5.2% |
| Filipinos | 99.0 /100 | #73 | Exceptional 5.2% |
| Afghans | 99.0 /100 | #74 | Exceptional 5.2% |
| Okinawans | 99.0 /100 | #75 | Exceptional 5.2% |
| Estonians | 99.0 /100 | #76 | Exceptional 5.2% |
| Immigrants | Sudan | 98.9 /100 | #77 | Exceptional 5.2% |
| Northern Europeans | 98.9 /100 | #78 | Exceptional 5.2% |
| Slavs | 98.7 /100 | #79 | Exceptional 5.2% |
| Immigrants | South Africa | 98.6 /100 | #80 | Exceptional 5.2% |
| Immigrants | Scotland | 98.6 /100 | #81 | Exceptional 5.2% |
| Thais | 98.6 /100 | #82 | Exceptional 5.2% |
| Immigrants | Middle Africa | 98.4 /100 | #83 | Exceptional 5.2% |
| Immigrants | Hungary | 98.0 /100 | #84 | Exceptional 5.2% |
| British | 97.9 /100 | #85 | Exceptional 5.2% |