Blackfeet vs Indonesian Unemployment Among Ages 30 to 34 years
COMPARE
Blackfeet
Indonesian
Unemployment Among Ages 30 to 34 years
Unemployment Among Ages 30 to 34 years Comparison
Blackfeet
Indonesians
6.3%
UNEMPLOYMENT AMONG AGES 30 TO 34 YEARS
0.0/ 100
METRIC RATING
272nd/ 347
METRIC RANK
5.2%
UNEMPLOYMENT AMONG AGES 30 TO 34 YEARS
95.1/ 100
METRIC RATING
78th/ 347
METRIC RANK
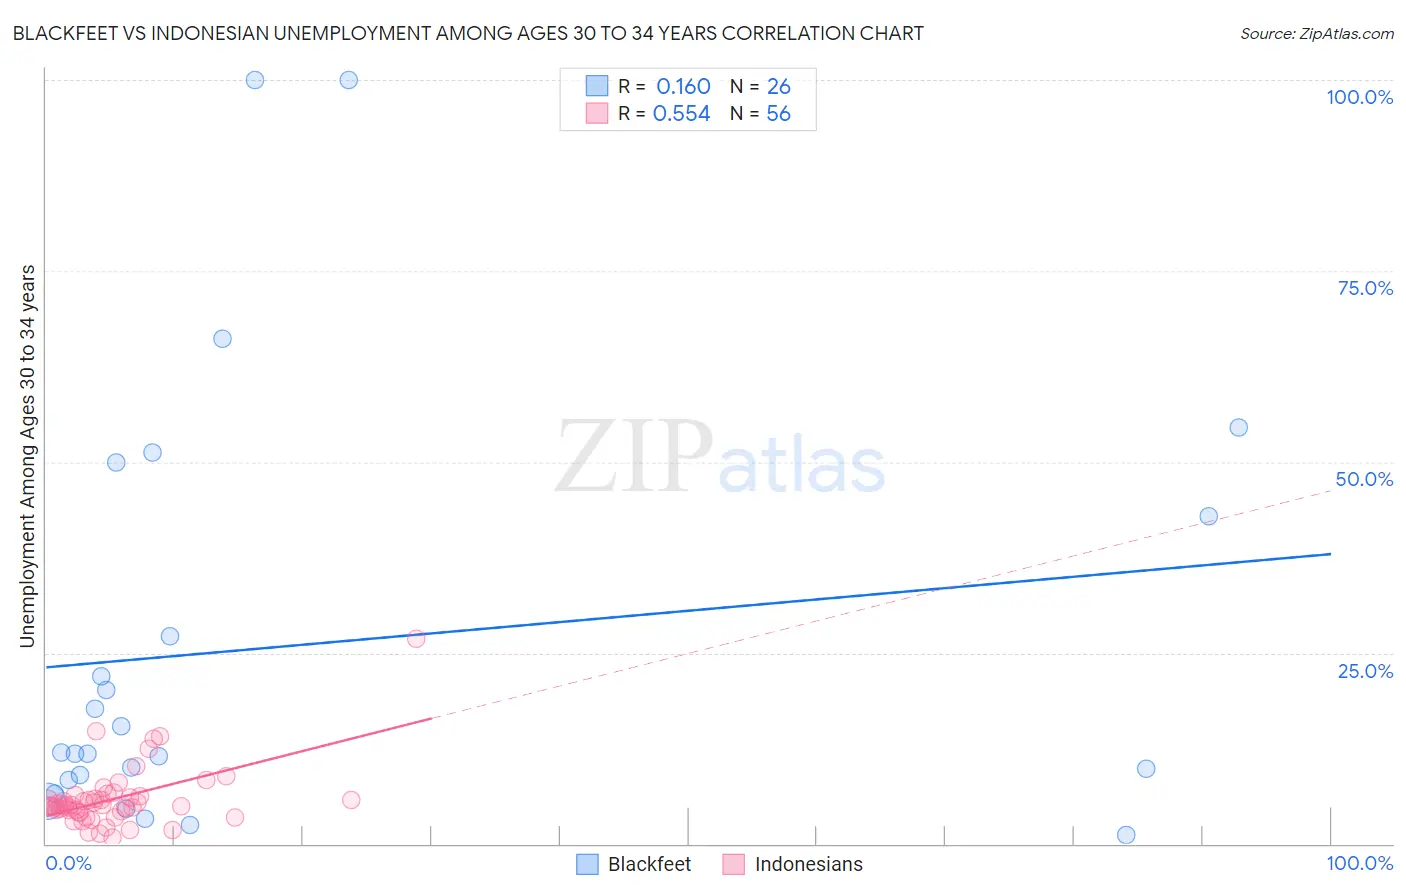
Blackfeet vs Indonesian Unemployment Among Ages 30 to 34 years Correlation Chart
The statistical analysis conducted on geographies consisting of 294,748,447 people shows a poor positive correlation between the proportion of Blackfeet and unemployment rate among population between the ages 30 and 34 in the United States with a correlation coefficient (R) of 0.160 and weighted average of 6.3%. Similarly, the statistical analysis conducted on geographies consisting of 159,189,213 people shows a substantial positive correlation between the proportion of Indonesians and unemployment rate among population between the ages 30 and 34 in the United States with a correlation coefficient (R) of 0.554 and weighted average of 5.2%, a difference of 21.1%.
Unemployment Among Ages 30 to 34 years Correlation Summary
| Measurement | Blackfeet | Indonesian |
| Minimum | 1.2% | 0.80% |
| Maximum | 100.0% | 26.8% |
| Range | 98.8% | 26.0% |
| Mean | 25.9% | 5.9% |
| Median | 11.9% | 5.0% |
| Interquartile 25% (IQ1) | 8.4% | 4.2% |
| Interquartile 75% (IQ3) | 42.9% | 6.2% |
| Interquartile Range (IQR) | 34.5% | 2.0% |
| Standard Deviation (Sample) | 28.3% | 4.1% |
| Standard Deviation (Population) | 27.7% | 4.0% |
Similar Demographics by Unemployment Among Ages 30 to 34 years
Demographics Similar to Blackfeet by Unemployment Among Ages 30 to 34 years
In terms of unemployment among ages 30 to 34 years, the demographic groups most similar to Blackfeet are Ottawa (6.3%, a difference of 0.010%), U.S. Virgin Islander (6.3%, a difference of 0.020%), Comanche (6.3%, a difference of 0.11%), Ecuadorian (6.3%, a difference of 0.13%), and Pennsylvania German (6.3%, a difference of 0.18%).
| Demographics | Rating | Rank | Unemployment Among Ages 30 to 34 years |
| Americans | 0.0 /100 | #265 | Tragic 6.2% |
| Seminole | 0.0 /100 | #266 | Tragic 6.2% |
| Immigrants | Mexico | 0.0 /100 | #267 | Tragic 6.2% |
| Immigrants | Haiti | 0.0 /100 | #268 | Tragic 6.2% |
| French American Indians | 0.0 /100 | #269 | Tragic 6.3% |
| Immigrants | Senegal | 0.0 /100 | #270 | Tragic 6.3% |
| Comanche | 0.0 /100 | #271 | Tragic 6.3% |
| Blackfeet | 0.0 /100 | #272 | Tragic 6.3% |
| Ottawa | 0.0 /100 | #273 | Tragic 6.3% |
| U.S. Virgin Islanders | 0.0 /100 | #274 | Tragic 6.3% |
| Ecuadorians | 0.0 /100 | #275 | Tragic 6.3% |
| Pennsylvania Germans | 0.0 /100 | #276 | Tragic 6.3% |
| Immigrants | Ecuador | 0.0 /100 | #277 | Tragic 6.3% |
| Osage | 0.0 /100 | #278 | Tragic 6.3% |
| Cree | 0.0 /100 | #279 | Tragic 6.4% |
Demographics Similar to Indonesians by Unemployment Among Ages 30 to 34 years
In terms of unemployment among ages 30 to 34 years, the demographic groups most similar to Indonesians are Immigrants from Lithuania (5.2%, a difference of 0.050%), Uruguayan (5.2%, a difference of 0.13%), Immigrants from Indonesia (5.2%, a difference of 0.15%), Scandinavian (5.2%, a difference of 0.20%), and Chilean (5.2%, a difference of 0.25%).
| Demographics | Rating | Rank | Unemployment Among Ages 30 to 34 years |
| Paraguayans | 96.4 /100 | #71 | Exceptional 5.1% |
| Immigrants | Moldova | 96.4 /100 | #72 | Exceptional 5.1% |
| Slovenes | 96.2 /100 | #73 | Exceptional 5.2% |
| Immigrants | Asia | 96.2 /100 | #74 | Exceptional 5.2% |
| Iranians | 96.0 /100 | #75 | Exceptional 5.2% |
| Scandinavians | 95.6 /100 | #76 | Exceptional 5.2% |
| Uruguayans | 95.4 /100 | #77 | Exceptional 5.2% |
| Indonesians | 95.1 /100 | #78 | Exceptional 5.2% |
| Immigrants | Lithuania | 95.0 /100 | #79 | Exceptional 5.2% |
| Immigrants | Indonesia | 94.7 /100 | #80 | Exceptional 5.2% |
| Chileans | 94.4 /100 | #81 | Exceptional 5.2% |
| Immigrants | Latvia | 94.2 /100 | #82 | Exceptional 5.2% |
| Immigrants | Korea | 94.1 /100 | #83 | Exceptional 5.2% |
| Immigrants | Uganda | 94.0 /100 | #84 | Exceptional 5.2% |
| Immigrants | Egypt | 93.9 /100 | #85 | Exceptional 5.2% |