Belizean vs Iroquois Female Unemployment
COMPARE
Belizean
Iroquois
Female Unemployment
Female Unemployment Comparison
Belizeans
Iroquois
6.3%
FEMALE UNEMPLOYMENT
0.0/ 100
METRIC RATING
313th/ 347
METRIC RANK
5.4%
FEMALE UNEMPLOYMENT
20.8/ 100
METRIC RATING
202nd/ 347
METRIC RANK
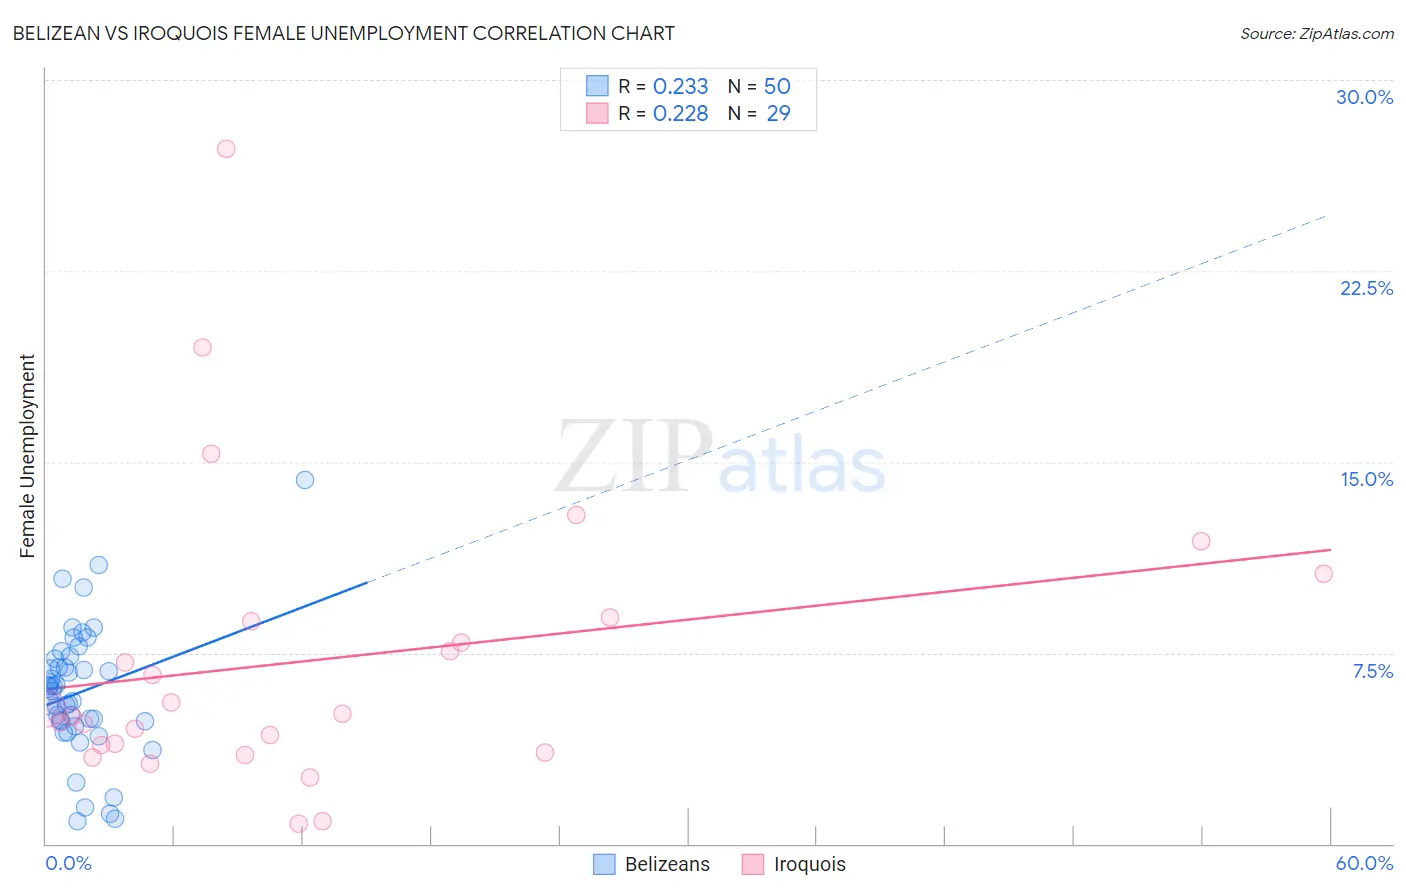
Belizean vs Iroquois Female Unemployment Correlation Chart
The statistical analysis conducted on geographies consisting of 144,062,837 people shows a weak positive correlation between the proportion of Belizeans and unemploymnet rate among females in the United States with a correlation coefficient (R) of 0.233 and weighted average of 6.3%. Similarly, the statistical analysis conducted on geographies consisting of 206,447,446 people shows a weak positive correlation between the proportion of Iroquois and unemploymnet rate among females in the United States with a correlation coefficient (R) of 0.228 and weighted average of 5.4%, a difference of 18.3%.
Female Unemployment Correlation Summary
| Measurement | Belizean | Iroquois |
| Minimum | 0.90% | 0.80% |
| Maximum | 14.3% | 27.3% |
| Range | 13.4% | 26.5% |
| Mean | 6.0% | 7.2% |
| Median | 6.1% | 5.1% |
| Interquartile 25% (IQ1) | 4.8% | 3.7% |
| Interquartile 75% (IQ3) | 7.3% | 8.8% |
| Interquartile Range (IQR) | 2.5% | 5.1% |
| Standard Deviation (Sample) | 2.6% | 5.7% |
| Standard Deviation (Population) | 2.5% | 5.6% |
Similar Demographics by Female Unemployment
Demographics Similar to Belizeans by Female Unemployment
In terms of female unemployment, the demographic groups most similar to Belizeans are Immigrants from Grenada (6.3%, a difference of 0.010%), Immigrants from Ecuador (6.4%, a difference of 0.23%), Pueblo (6.4%, a difference of 0.54%), Immigrants from Mexico (6.3%, a difference of 0.67%), and Central American Indian (6.3%, a difference of 0.81%).
| Demographics | Rating | Rank | Female Unemployment |
| Immigrants | Central America | 0.0 /100 | #306 | Tragic 6.2% |
| Shoshone | 0.0 /100 | #307 | Tragic 6.2% |
| Hispanics or Latinos | 0.0 /100 | #308 | Tragic 6.2% |
| Ecuadorians | 0.0 /100 | #309 | Tragic 6.3% |
| Central American Indians | 0.0 /100 | #310 | Tragic 6.3% |
| Immigrants | Mexico | 0.0 /100 | #311 | Tragic 6.3% |
| Immigrants | Grenada | 0.0 /100 | #312 | Tragic 6.3% |
| Belizeans | 0.0 /100 | #313 | Tragic 6.3% |
| Immigrants | Ecuador | 0.0 /100 | #314 | Tragic 6.4% |
| Pueblo | 0.0 /100 | #315 | Tragic 6.4% |
| Houma | 0.0 /100 | #316 | Tragic 6.4% |
| Immigrants | St. Vincent and the Grenadines | 0.0 /100 | #317 | Tragic 6.4% |
| British West Indians | 0.0 /100 | #318 | Tragic 6.4% |
| Immigrants | Bangladesh | 0.0 /100 | #319 | Tragic 6.5% |
| Immigrants | Dominica | 0.0 /100 | #320 | Tragic 6.5% |
Demographics Similar to Iroquois by Female Unemployment
In terms of female unemployment, the demographic groups most similar to Iroquois are Immigrants from Middle Africa (5.4%, a difference of 0.0%), Immigrants from South Eastern Asia (5.4%, a difference of 0.040%), Soviet Union (5.4%, a difference of 0.080%), Immigrants from Israel (5.4%, a difference of 0.10%), and Hawaiian (5.4%, a difference of 0.12%).
| Demographics | Rating | Rank | Female Unemployment |
| Immigrants | Colombia | 26.2 /100 | #195 | Fair 5.3% |
| Spaniards | 25.2 /100 | #196 | Fair 5.3% |
| Alsatians | 23.9 /100 | #197 | Fair 5.3% |
| Tsimshian | 23.1 /100 | #198 | Fair 5.4% |
| Hawaiians | 22.2 /100 | #199 | Fair 5.4% |
| Soviet Union | 21.7 /100 | #200 | Fair 5.4% |
| Immigrants | Middle Africa | 20.8 /100 | #201 | Fair 5.4% |
| Iroquois | 20.8 /100 | #202 | Fair 5.4% |
| Immigrants | South Eastern Asia | 20.3 /100 | #203 | Fair 5.4% |
| Immigrants | Israel | 19.7 /100 | #204 | Poor 5.4% |
| Immigrants | Afghanistan | 18.9 /100 | #205 | Poor 5.4% |
| Immigrants | Brazil | 18.8 /100 | #206 | Poor 5.4% |
| Creek | 15.4 /100 | #207 | Poor 5.4% |
| Immigrants | Costa Rica | 13.7 /100 | #208 | Poor 5.4% |
| Koreans | 13.4 /100 | #209 | Poor 5.4% |