Basque vs Immigrants from Moldova Unemployment Among Ages 60 to 64 years
COMPARE
Basque
Immigrants from Moldova
Unemployment Among Ages 60 to 64 years
Unemployment Among Ages 60 to 64 years Comparison
Basques
Immigrants from Moldova
4.8%
UNEMPLOYMENT AMONG AGES 60 TO 64 YEARS
88.8/ 100
METRIC RATING
134th/ 347
METRIC RANK
4.6%
UNEMPLOYMENT AMONG AGES 60 TO 64 YEARS
99.9/ 100
METRIC RATING
53rd/ 347
METRIC RANK
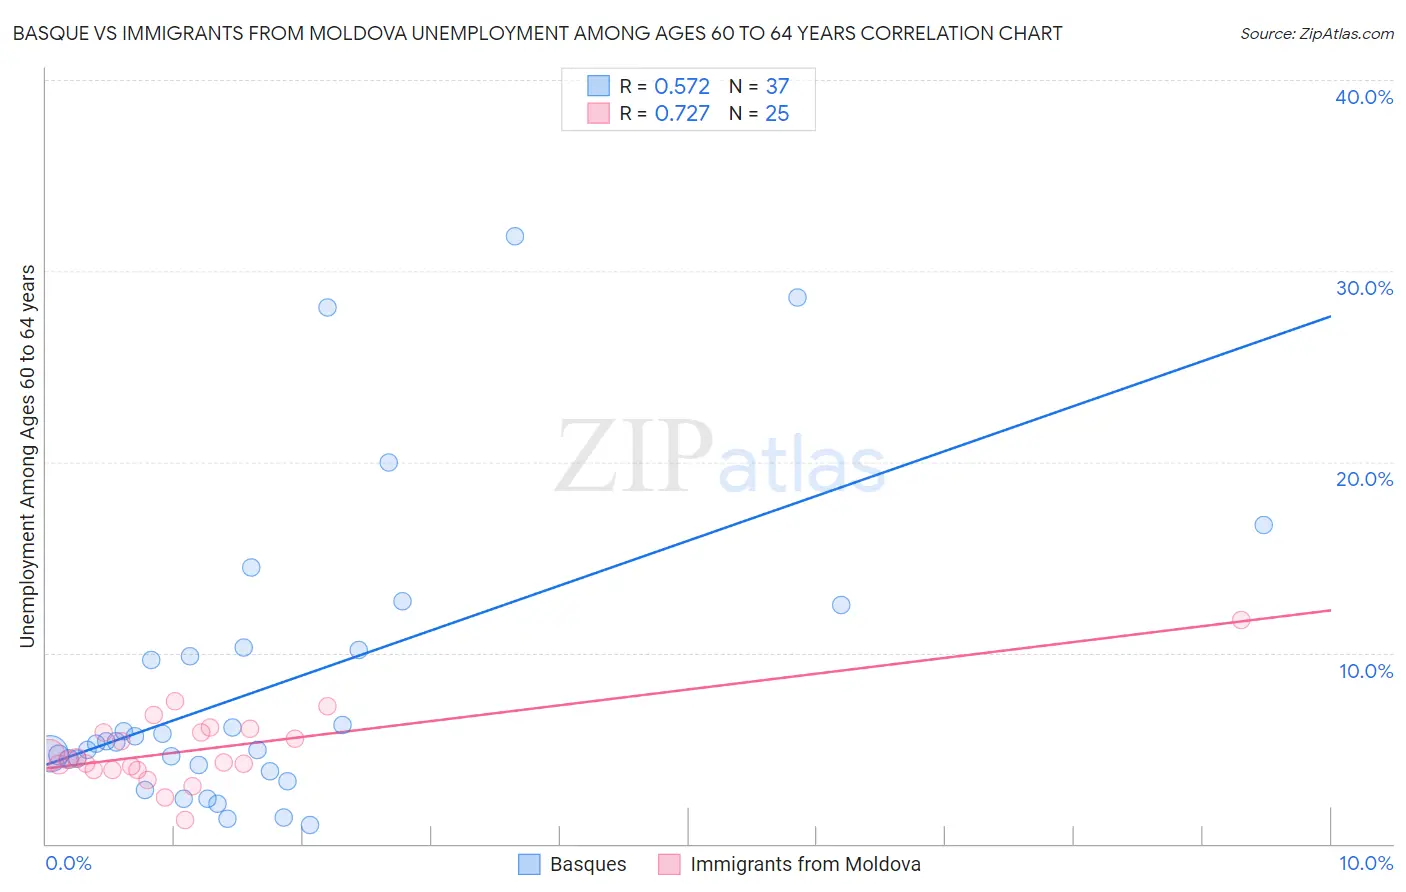
Basque vs Immigrants from Moldova Unemployment Among Ages 60 to 64 years Correlation Chart
The statistical analysis conducted on geographies consisting of 158,733,048 people shows a substantial positive correlation between the proportion of Basques and unemployment rate among population between the ages 60 and 64 in the United States with a correlation coefficient (R) of 0.572 and weighted average of 4.8%. Similarly, the statistical analysis conducted on geographies consisting of 120,329,754 people shows a strong positive correlation between the proportion of Immigrants from Moldova and unemployment rate among population between the ages 60 and 64 in the United States with a correlation coefficient (R) of 0.727 and weighted average of 4.6%, a difference of 4.3%.
Unemployment Among Ages 60 to 64 years Correlation Summary
| Measurement | Basque | Immigrants from Moldova |
| Minimum | 1.0% | 1.2% |
| Maximum | 31.8% | 11.7% |
| Range | 30.8% | 10.5% |
| Mean | 8.3% | 4.9% |
| Median | 5.3% | 4.4% |
| Interquartile 25% (IQ1) | 3.9% | 3.9% |
| Interquartile 75% (IQ3) | 10.2% | 5.9% |
| Interquartile Range (IQR) | 6.3% | 2.0% |
| Standard Deviation (Sample) | 7.7% | 2.0% |
| Standard Deviation (Population) | 7.6% | 2.0% |
Similar Demographics by Unemployment Among Ages 60 to 64 years
Demographics Similar to Basques by Unemployment Among Ages 60 to 64 years
In terms of unemployment among ages 60 to 64 years, the demographic groups most similar to Basques are Yaqui (4.8%, a difference of 0.060%), Immigrants from Lebanon (4.8%, a difference of 0.080%), Lithuanian (4.8%, a difference of 0.080%), Pennsylvania German (4.8%, a difference of 0.090%), and French Canadian (4.8%, a difference of 0.10%).
| Demographics | Rating | Rank | Unemployment Among Ages 60 to 64 years |
| Austrians | 91.9 /100 | #127 | Exceptional 4.8% |
| Choctaw | 90.3 /100 | #128 | Exceptional 4.8% |
| Immigrants | Serbia | 90.2 /100 | #129 | Exceptional 4.8% |
| Immigrants | Syria | 90.1 /100 | #130 | Exceptional 4.8% |
| Immigrants | Lebanon | 89.6 /100 | #131 | Excellent 4.8% |
| Lithuanians | 89.6 /100 | #132 | Excellent 4.8% |
| Yaqui | 89.5 /100 | #133 | Excellent 4.8% |
| Basques | 88.8 /100 | #134 | Excellent 4.8% |
| Pennsylvania Germans | 87.8 /100 | #135 | Excellent 4.8% |
| French Canadians | 87.6 /100 | #136 | Excellent 4.8% |
| Cambodians | 86.9 /100 | #137 | Excellent 4.8% |
| Immigrants | Lithuania | 86.7 /100 | #138 | Excellent 4.8% |
| Immigrants | Africa | 86.6 /100 | #139 | Excellent 4.8% |
| Pima | 85.8 /100 | #140 | Excellent 4.8% |
| Panamanians | 85.5 /100 | #141 | Excellent 4.8% |
Demographics Similar to Immigrants from Moldova by Unemployment Among Ages 60 to 64 years
In terms of unemployment among ages 60 to 64 years, the demographic groups most similar to Immigrants from Moldova are Dutch (4.6%, a difference of 0.030%), Bangladeshi (4.6%, a difference of 0.050%), Kenyan (4.6%, a difference of 0.11%), Immigrants from Kenya (4.6%, a difference of 0.12%), and Welsh (4.6%, a difference of 0.14%).
| Demographics | Rating | Rank | Unemployment Among Ages 60 to 64 years |
| Bhutanese | 99.9 /100 | #46 | Exceptional 4.5% |
| Assyrians/Chaldeans/Syriacs | 99.9 /100 | #47 | Exceptional 4.5% |
| Immigrants | Zimbabwe | 99.9 /100 | #48 | Exceptional 4.6% |
| Scotch-Irish | 99.9 /100 | #49 | Exceptional 4.6% |
| Scottish | 99.9 /100 | #50 | Exceptional 4.6% |
| Immigrants | Kenya | 99.9 /100 | #51 | Exceptional 4.6% |
| Kenyans | 99.9 /100 | #52 | Exceptional 4.6% |
| Immigrants | Moldova | 99.9 /100 | #53 | Exceptional 4.6% |
| Dutch | 99.9 /100 | #54 | Exceptional 4.6% |
| Bangladeshis | 99.9 /100 | #55 | Exceptional 4.6% |
| Welsh | 99.9 /100 | #56 | Exceptional 4.6% |
| British | 99.9 /100 | #57 | Exceptional 4.6% |
| Immigrants | India | 99.8 /100 | #58 | Exceptional 4.6% |
| Swiss | 99.8 /100 | #59 | Exceptional 4.6% |
| Puget Sound Salish | 99.8 /100 | #60 | Exceptional 4.6% |