Basque vs Immigrants from Germany Unemployment Among Ages 60 to 64 years
COMPARE
Basque
Immigrants from Germany
Unemployment Among Ages 60 to 64 years
Unemployment Among Ages 60 to 64 years Comparison
Basques
Immigrants from Germany
4.8%
UNEMPLOYMENT AMONG AGES 60 TO 64 YEARS
88.8/ 100
METRIC RATING
134th/ 347
METRIC RANK
4.7%
UNEMPLOYMENT AMONG AGES 60 TO 64 YEARS
96.3/ 100
METRIC RATING
117th/ 347
METRIC RANK
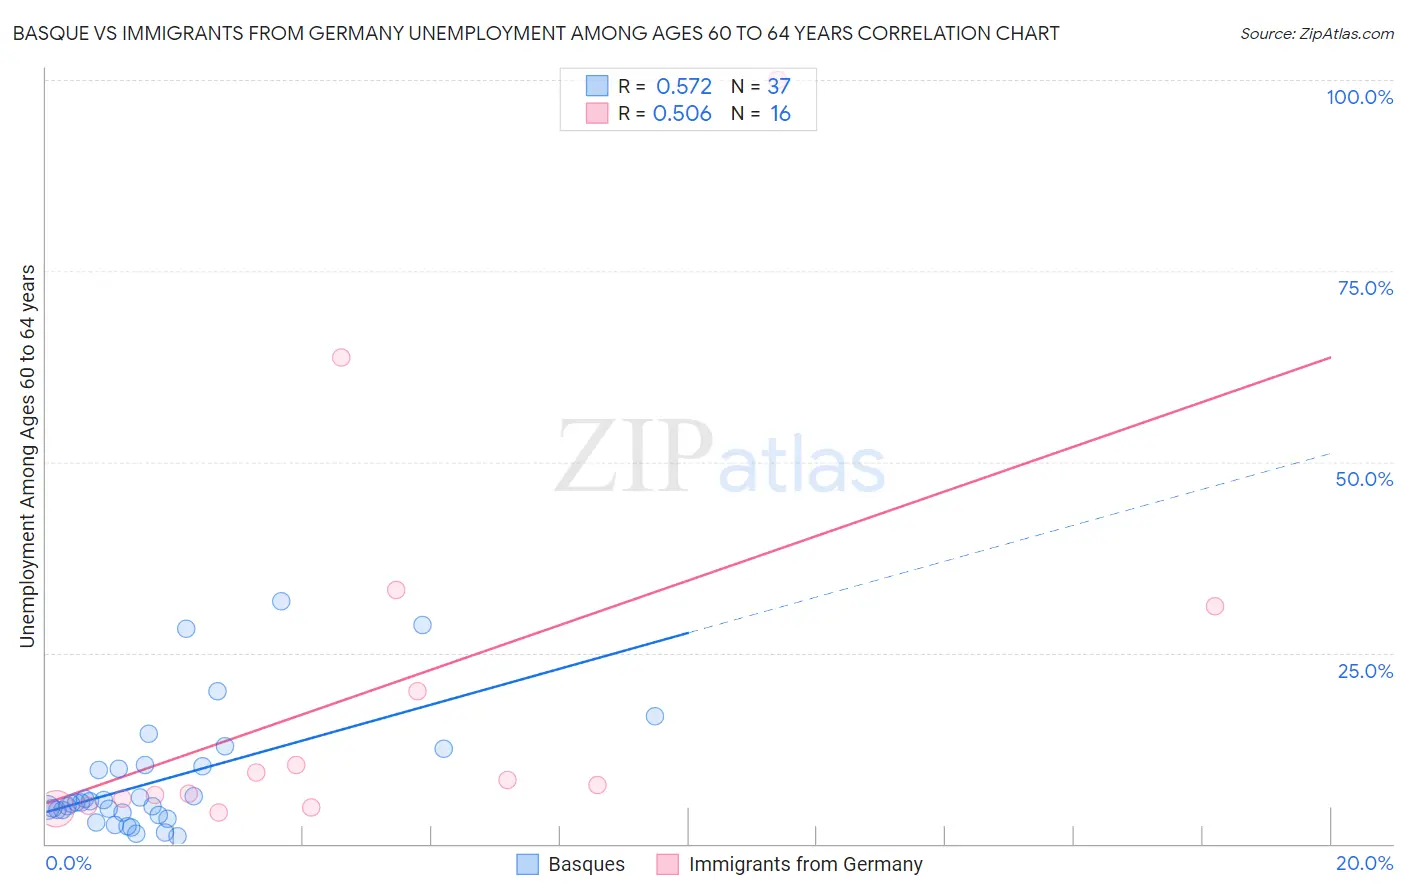
Basque vs Immigrants from Germany Unemployment Among Ages 60 to 64 years Correlation Chart
The statistical analysis conducted on geographies consisting of 158,733,048 people shows a substantial positive correlation between the proportion of Basques and unemployment rate among population between the ages 60 and 64 in the United States with a correlation coefficient (R) of 0.572 and weighted average of 4.8%. Similarly, the statistical analysis conducted on geographies consisting of 407,856,644 people shows a substantial positive correlation between the proportion of Immigrants from Germany and unemployment rate among population between the ages 60 and 64 in the United States with a correlation coefficient (R) of 0.506 and weighted average of 4.7%, a difference of 1.1%.
Unemployment Among Ages 60 to 64 years Correlation Summary
| Measurement | Basque | Immigrants from Germany |
| Minimum | 1.0% | 4.1% |
| Maximum | 31.8% | 100.0% |
| Range | 30.8% | 95.9% |
| Mean | 8.3% | 20.1% |
| Median | 5.3% | 8.1% |
| Interquartile 25% (IQ1) | 3.9% | 5.4% |
| Interquartile 75% (IQ3) | 10.2% | 25.6% |
| Interquartile Range (IQR) | 6.3% | 20.1% |
| Standard Deviation (Sample) | 7.7% | 26.6% |
| Standard Deviation (Population) | 7.6% | 25.8% |
Demographics Similar to Basques and Immigrants from Germany by Unemployment Among Ages 60 to 64 years
In terms of unemployment among ages 60 to 64 years, the demographic groups most similar to Basques are Yaqui (4.8%, a difference of 0.060%), Immigrants from Lebanon (4.8%, a difference of 0.080%), Lithuanian (4.8%, a difference of 0.080%), Pennsylvania German (4.8%, a difference of 0.090%), and Immigrants from Syria (4.8%, a difference of 0.13%). Similarly, the demographic groups most similar to Immigrants from Germany are Immigrants from England (4.7%, a difference of 0.0%), Immigrants from Romania (4.7%, a difference of 0.040%), Ukrainian (4.7%, a difference of 0.050%), Immigrants from Morocco (4.7%, a difference of 0.14%), and Macedonian (4.7%, a difference of 0.15%).
| Demographics | Rating | Rank | Unemployment Among Ages 60 to 64 years |
| Immigrants | Romania | 96.4 /100 | #115 | Exceptional 4.7% |
| Immigrants | England | 96.3 /100 | #116 | Exceptional 4.7% |
| Immigrants | Germany | 96.3 /100 | #117 | Exceptional 4.7% |
| Ukrainians | 96.1 /100 | #118 | Exceptional 4.7% |
| Immigrants | Morocco | 95.7 /100 | #119 | Exceptional 4.7% |
| Macedonians | 95.7 /100 | #120 | Exceptional 4.7% |
| Albanians | 95.3 /100 | #121 | Exceptional 4.7% |
| Immigrants | Kazakhstan | 95.1 /100 | #122 | Exceptional 4.7% |
| Finns | 94.7 /100 | #123 | Exceptional 4.7% |
| Immigrants | Senegal | 94.5 /100 | #124 | Exceptional 4.7% |
| Immigrants | Thailand | 93.7 /100 | #125 | Exceptional 4.7% |
| Immigrants | South Central Asia | 93.0 /100 | #126 | Exceptional 4.7% |
| Austrians | 91.9 /100 | #127 | Exceptional 4.8% |
| Choctaw | 90.3 /100 | #128 | Exceptional 4.8% |
| Immigrants | Serbia | 90.2 /100 | #129 | Exceptional 4.8% |
| Immigrants | Syria | 90.1 /100 | #130 | Exceptional 4.8% |
| Immigrants | Lebanon | 89.6 /100 | #131 | Excellent 4.8% |
| Lithuanians | 89.6 /100 | #132 | Excellent 4.8% |
| Yaqui | 89.5 /100 | #133 | Excellent 4.8% |
| Basques | 88.8 /100 | #134 | Excellent 4.8% |
| Pennsylvania Germans | 87.8 /100 | #135 | Excellent 4.8% |