Barbadian vs Bermudan Unemployment Among Women with Children Under 18 years
COMPARE
Barbadian
Bermudan
Unemployment Among Women with Children Under 18 years
Unemployment Among Women with Children Under 18 years Comparison
Barbadians
Bermudans
6.4%
UNEMPLOYMENT AMONG WOMEN WITH CHILDREN UNDER 18 YEARS
0.0/ 100
METRIC RATING
295th/ 347
METRIC RANK
6.1%
UNEMPLOYMENT AMONG WOMEN WITH CHILDREN UNDER 18 YEARS
0.1/ 100
METRIC RATING
257th/ 347
METRIC RANK
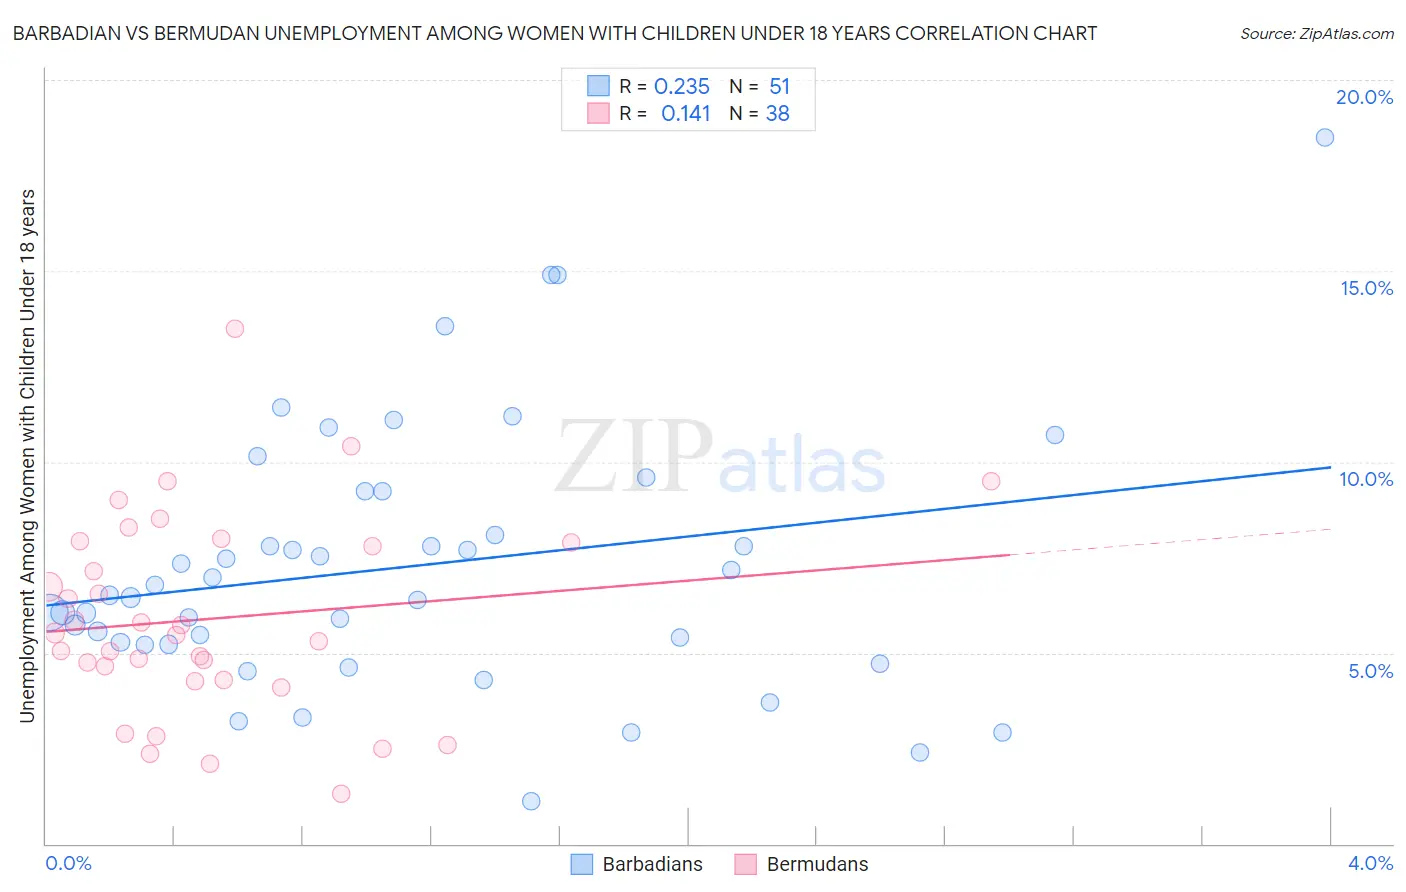
Barbadian vs Bermudan Unemployment Among Women with Children Under 18 years Correlation Chart
The statistical analysis conducted on geographies consisting of 139,822,827 people shows a weak positive correlation between the proportion of Barbadians and unemployment rate among women with children under the age of 18 in the United States with a correlation coefficient (R) of 0.235 and weighted average of 6.4%. Similarly, the statistical analysis conducted on geographies consisting of 55,293,080 people shows a poor positive correlation between the proportion of Bermudans and unemployment rate among women with children under the age of 18 in the United States with a correlation coefficient (R) of 0.141 and weighted average of 6.1%, a difference of 5.1%.
Unemployment Among Women with Children Under 18 years Correlation Summary
| Measurement | Barbadian | Bermudan |
| Minimum | 1.1% | 1.3% |
| Maximum | 18.5% | 13.5% |
| Range | 17.4% | 12.2% |
| Mean | 7.3% | 5.9% |
| Median | 6.5% | 5.5% |
| Interquartile 25% (IQ1) | 5.2% | 4.3% |
| Interquartile 75% (IQ3) | 9.2% | 7.9% |
| Interquartile Range (IQR) | 4.0% | 3.6% |
| Standard Deviation (Sample) | 3.4% | 2.6% |
| Standard Deviation (Population) | 3.4% | 2.6% |
Similar Demographics by Unemployment Among Women with Children Under 18 years
Demographics Similar to Barbadians by Unemployment Among Women with Children Under 18 years
In terms of unemployment among women with children under 18 years, the demographic groups most similar to Barbadians are Haitian (6.4%, a difference of 0.020%), Immigrants from Senegal (6.4%, a difference of 0.060%), Honduran (6.4%, a difference of 0.080%), Immigrants from Bangladesh (6.4%, a difference of 0.11%), and Mexican (6.4%, a difference of 0.14%).
| Demographics | Rating | Rank | Unemployment Among Women with Children Under 18 years |
| Cree | 0.0 /100 | #288 | Tragic 6.3% |
| Immigrants | Caribbean | 0.0 /100 | #289 | Tragic 6.4% |
| Blackfeet | 0.0 /100 | #290 | Tragic 6.4% |
| Immigrants | Guatemala | 0.0 /100 | #291 | Tragic 6.4% |
| Mexicans | 0.0 /100 | #292 | Tragic 6.4% |
| Immigrants | Bangladesh | 0.0 /100 | #293 | Tragic 6.4% |
| Hondurans | 0.0 /100 | #294 | Tragic 6.4% |
| Barbadians | 0.0 /100 | #295 | Tragic 6.4% |
| Haitians | 0.0 /100 | #296 | Tragic 6.4% |
| Immigrants | Senegal | 0.0 /100 | #297 | Tragic 6.4% |
| Immigrants | Latin America | 0.0 /100 | #298 | Tragic 6.4% |
| Jamaicans | 0.0 /100 | #299 | Tragic 6.4% |
| Immigrants | Jamaica | 0.0 /100 | #300 | Tragic 6.4% |
| Immigrants | Haiti | 0.0 /100 | #301 | Tragic 6.4% |
| Immigrants | Armenia | 0.0 /100 | #302 | Tragic 6.5% |
Demographics Similar to Bermudans by Unemployment Among Women with Children Under 18 years
In terms of unemployment among women with children under 18 years, the demographic groups most similar to Bermudans are Immigrants from Nigeria (6.1%, a difference of 0.19%), Nepalese (6.0%, a difference of 0.53%), Liberian (6.0%, a difference of 0.61%), Ottawa (6.1%, a difference of 0.86%), and Nigerian (6.1%, a difference of 0.88%).
| Demographics | Rating | Rank | Unemployment Among Women with Children Under 18 years |
| Immigrants | Cabo Verde | 0.7 /100 | #250 | Tragic 5.9% |
| Ute | 0.7 /100 | #251 | Tragic 5.9% |
| Seminole | 0.5 /100 | #252 | Tragic 6.0% |
| Immigrants | Congo | 0.4 /100 | #253 | Tragic 6.0% |
| Immigrants | Azores | 0.3 /100 | #254 | Tragic 6.0% |
| Liberians | 0.2 /100 | #255 | Tragic 6.0% |
| Nepalese | 0.2 /100 | #256 | Tragic 6.0% |
| Bermudans | 0.1 /100 | #257 | Tragic 6.1% |
| Immigrants | Nigeria | 0.1 /100 | #258 | Tragic 6.1% |
| Ottawa | 0.1 /100 | #259 | Tragic 6.1% |
| Nigerians | 0.1 /100 | #260 | Tragic 6.1% |
| Immigrants | Liberia | 0.1 /100 | #261 | Tragic 6.1% |
| Immigrants | Trinidad and Tobago | 0.1 /100 | #262 | Tragic 6.1% |
| Spanish American Indians | 0.1 /100 | #263 | Tragic 6.1% |
| Comanche | 0.1 /100 | #264 | Tragic 6.1% |