Immigrants from Ireland vs Welsh Unemployment Among Women with Children Under 18 years
COMPARE
Immigrants from Ireland
Welsh
Unemployment Among Women with Children Under 18 years
Unemployment Among Women with Children Under 18 years Comparison
Immigrants from Ireland
Welsh
5.1%
UNEMPLOYMENT AMONG WOMEN WITH CHILDREN UNDER 18 YEARS
98.0/ 100
METRIC RATING
56th/ 347
METRIC RANK
5.1%
UNEMPLOYMENT AMONG WOMEN WITH CHILDREN UNDER 18 YEARS
97.7/ 100
METRIC RATING
60th/ 347
METRIC RANK
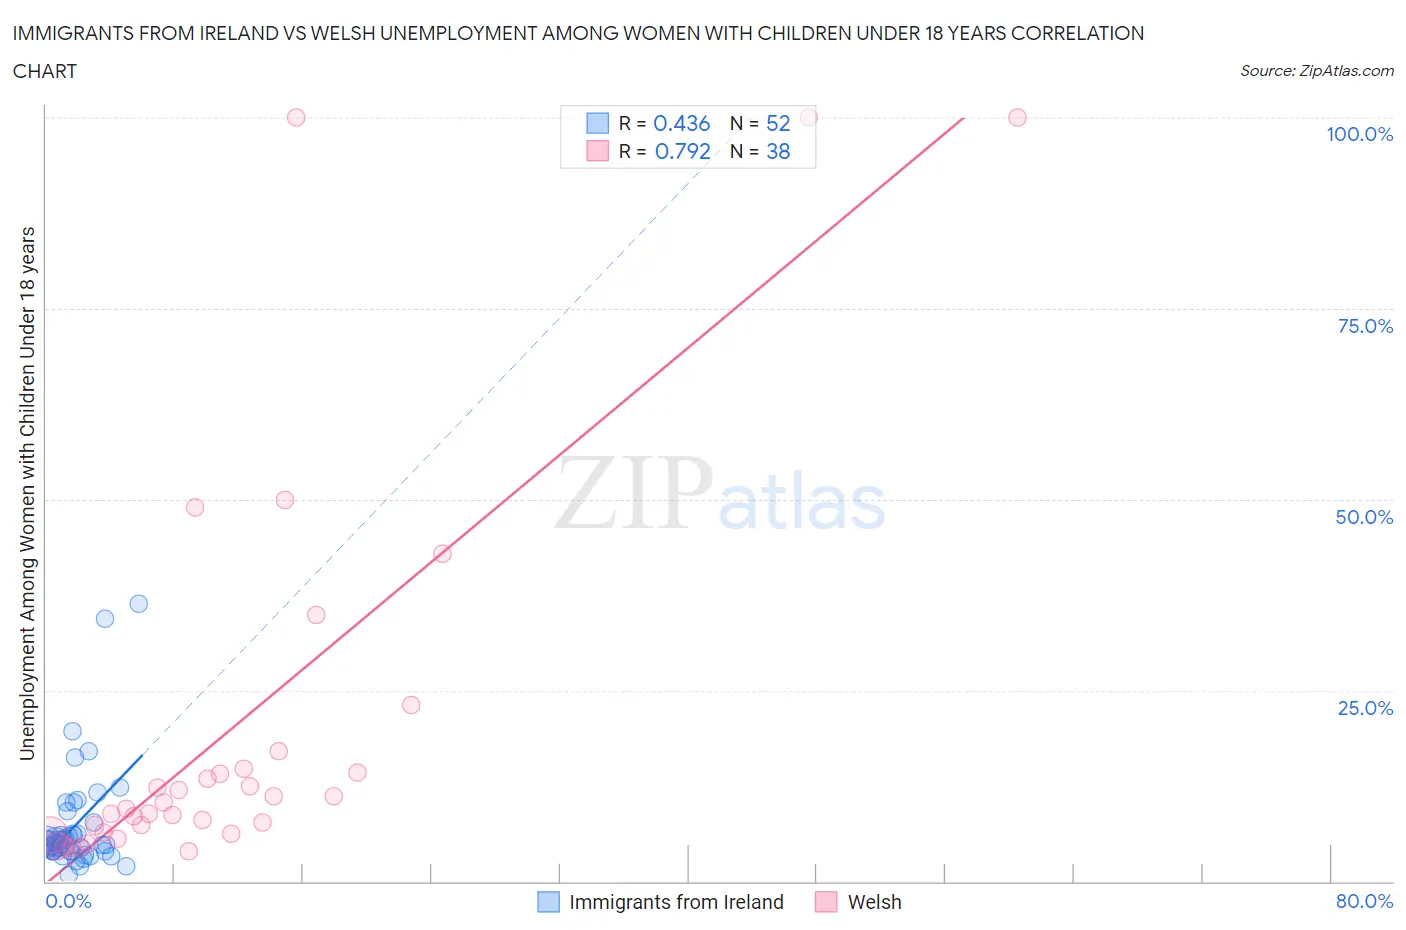
Immigrants from Ireland vs Welsh Unemployment Among Women with Children Under 18 years Correlation Chart
The statistical analysis conducted on geographies consisting of 233,977,217 people shows a moderate positive correlation between the proportion of Immigrants from Ireland and unemployment rate among women with children under the age of 18 in the United States with a correlation coefficient (R) of 0.436 and weighted average of 5.1%. Similarly, the statistical analysis conducted on geographies consisting of 484,131,801 people shows a strong positive correlation between the proportion of Welsh and unemployment rate among women with children under the age of 18 in the United States with a correlation coefficient (R) of 0.792 and weighted average of 5.1%, a difference of 0.30%.
Unemployment Among Women with Children Under 18 years Correlation Summary
| Measurement | Immigrants from Ireland | Welsh |
| Minimum | 0.90% | 3.9% |
| Maximum | 36.4% | 100.0% |
| Range | 35.5% | 96.1% |
| Mean | 7.2% | 20.2% |
| Median | 5.0% | 9.8% |
| Interquartile 25% (IQ1) | 4.0% | 6.3% |
| Interquartile 75% (IQ3) | 6.2% | 14.8% |
| Interquartile Range (IQR) | 2.2% | 8.5% |
| Standard Deviation (Sample) | 6.8% | 26.4% |
| Standard Deviation (Population) | 6.8% | 26.0% |
Demographics Similar to Immigrants from Ireland and Welsh by Unemployment Among Women with Children Under 18 years
In terms of unemployment among women with children under 18 years, the demographic groups most similar to Immigrants from Ireland are Immigrants from Sri Lanka (5.1%, a difference of 0.040%), Czechoslovakian (5.1%, a difference of 0.050%), Immigrants from Belgium (5.1%, a difference of 0.14%), Asian (5.1%, a difference of 0.15%), and Immigrants from Serbia (5.1%, a difference of 0.17%). Similarly, the demographic groups most similar to Welsh are Asian (5.1%, a difference of 0.15%), Russian (5.1%, a difference of 0.15%), Immigrants from Belgium (5.1%, a difference of 0.17%), Immigrants from Bulgaria (5.1%, a difference of 0.22%), and Italian (5.1%, a difference of 0.23%).
| Demographics | Rating | Rank | Unemployment Among Women with Children Under 18 years |
| Northern Europeans | 98.6 /100 | #48 | Exceptional 5.0% |
| Lithuanians | 98.4 /100 | #49 | Exceptional 5.0% |
| Immigrants | Japan | 98.4 /100 | #50 | Exceptional 5.0% |
| Yugoslavians | 98.3 /100 | #51 | Exceptional 5.1% |
| Immigrants | Nepal | 98.3 /100 | #52 | Exceptional 5.1% |
| Scottish | 98.2 /100 | #53 | Exceptional 5.1% |
| Immigrants | Serbia | 98.2 /100 | #54 | Exceptional 5.1% |
| Immigrants | Sri Lanka | 98.1 /100 | #55 | Exceptional 5.1% |
| Immigrants | Ireland | 98.0 /100 | #56 | Exceptional 5.1% |
| Czechoslovakians | 98.0 /100 | #57 | Exceptional 5.1% |
| Immigrants | Belgium | 97.9 /100 | #58 | Exceptional 5.1% |
| Asians | 97.9 /100 | #59 | Exceptional 5.1% |
| Welsh | 97.7 /100 | #60 | Exceptional 5.1% |
| Russians | 97.5 /100 | #61 | Exceptional 5.1% |
| Immigrants | Bulgaria | 97.4 /100 | #62 | Exceptional 5.1% |
| Italians | 97.4 /100 | #63 | Exceptional 5.1% |
| Estonians | 97.2 /100 | #64 | Exceptional 5.1% |
| Immigrants | Sweden | 97.1 /100 | #65 | Exceptional 5.1% |
| Immigrants | Australia | 97.0 /100 | #66 | Exceptional 5.1% |
| Fijians | 96.9 /100 | #67 | Exceptional 5.1% |
| Irish | 96.8 /100 | #68 | Exceptional 5.1% |